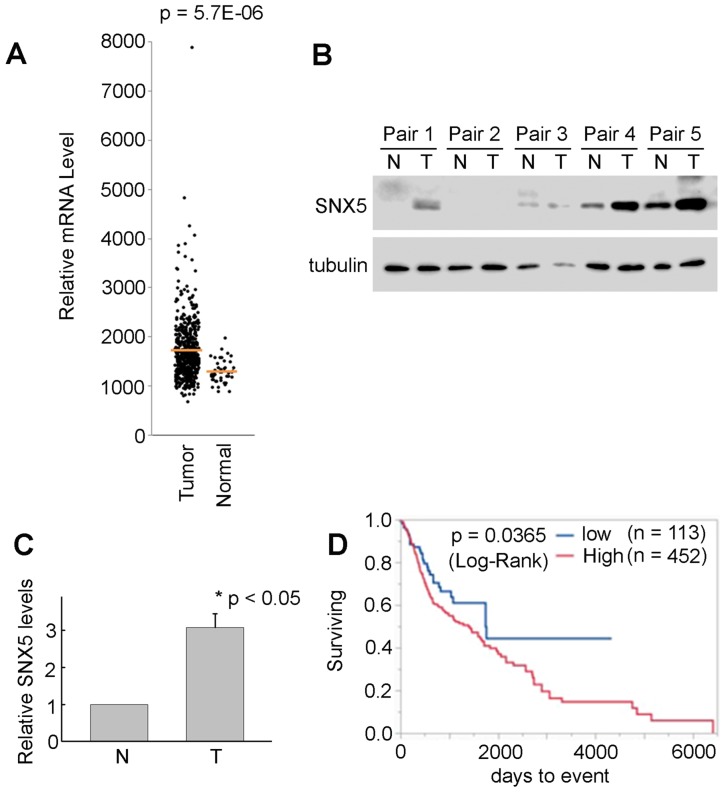
Figure 1.
SNX5 Expression in HNSCC and normal tissues. (A) SNX5 transcript levels were compared in normal and HNSCC primary tumors based on analysis from TCGA data. (B) SNX5 expression was determined by Western blot analysis in 5 pairs of primary HNSCC tumors (T) and their matched non-cancerous tissues (N). Tubulin was used as a loading control. (C) Quantification of relative SNX5 protein expression levels in (B). (D) Kaplan-Meier plots indicate that higher SNX5 expression correlates with worse overall survival.

