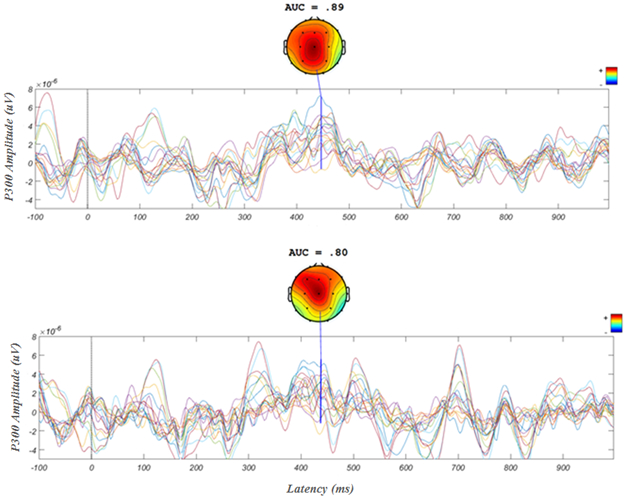
Figure 2.

Evoked potential to target letters from a single subject from the first and best (top) and last and worst (bottom) calibration session as assessed by AUC. The chosen participant had one of the biggest changes from first to last session. These figures display all 21 channels and a heat map shows distribution of the P300. One can see the typical P300 maximal Cz topographical distribution and the significantly more consistent and higher amplitude P300 in the first compared with the last session.
