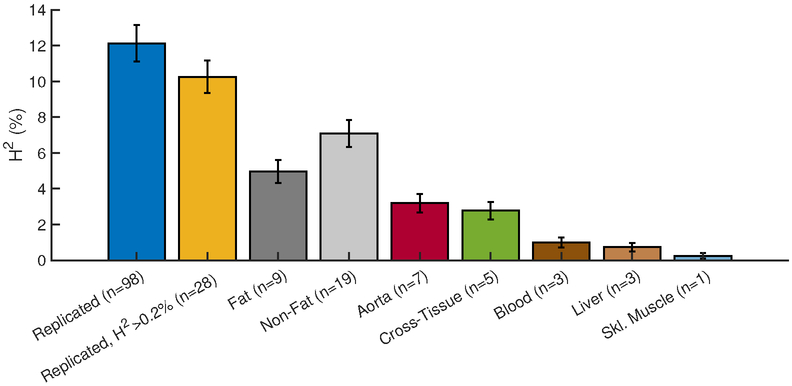
Figure 1. Contribution to CAD heritability from expression (e)SNPs of regulatory gene networks identified in STAGE/STARNET.
Bar plots of CAD heritability (H2) contributions from 98 regulatory-gene networks identified in the STAGE study(11) and replicated in STARNET(12) (blue). The yellow bar indicates contribution to H2 from the top-28 networks, each contributing >0.2% CAD heritability. The following bars show H2 contributions from subsets of these 28 regulatory gene networks according to their tissue of origin (n = number of networks). Non-fat refers to networks found in tissues other than fat; H2 error bars are standard error of mean.

