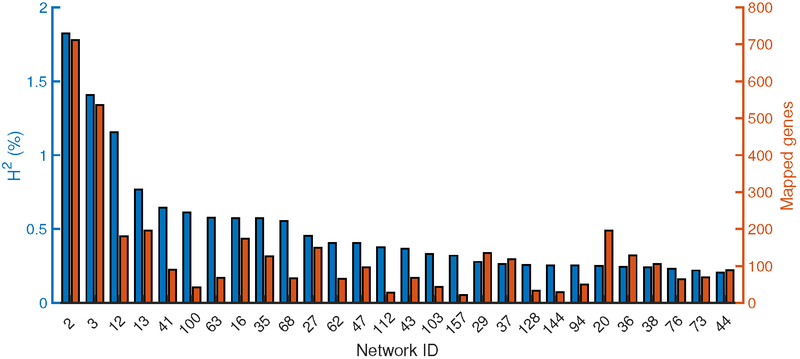
Figure 2. Individual contributions to heritability from top-28 regulatory-gene networks associated with CAD.
Bar plots of CAD heritability (H2) contributions (blue, left y-axis) and network-gene number (red, right y-axis) of the top-28 regulatory-gene networks (>0.2% h2/network, Online Figures 4 and 5).

