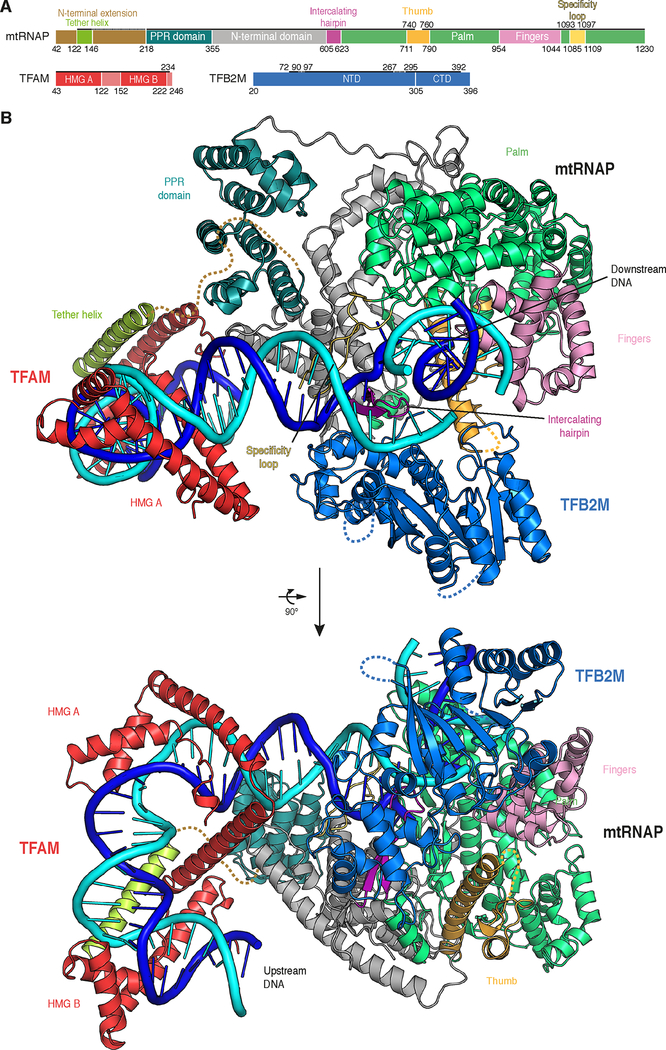
Figure 2 |. Structure of the human mitochondrial transcription initiation complex.
(A) Schematic representation of mtRNAP, TFAM and TFB2M. Important structural elements are indicated with flanking residue numbers. Regions with interpretable electron density in the IC crystal structure are indicated by a solid black line. Regions with density of insufficient quality for model building are indicated by a dashed black line. The colour code is used throughout.
(B) Ribbon representation of the IC structure assembled on LSP DNA. Important structural elements are indicated.
See also Figure S2.

