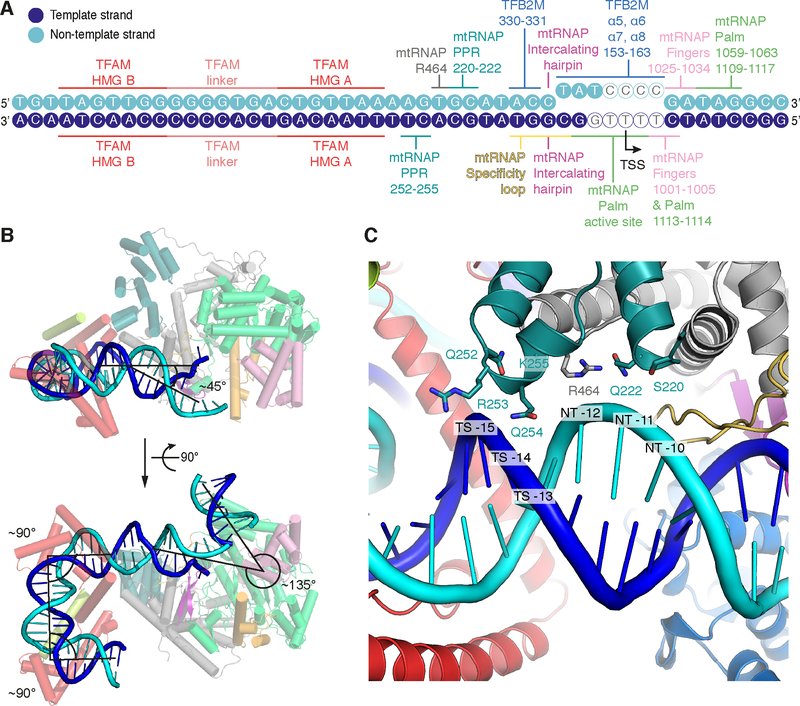
Figure 3 |. Promoter DNA interactions in the IC and DNA bending.
(A) Schematic representation of protein-DNA interactions in the IC. DNA bases of the LSP promoter scaffold used for crystallization are depicted as circles in blue and cyan for the template and non-template strand, respectively. DNA bases lacking density in the IC crystal structure are depicted as hollow circles. Protein regions interacting with the DNA are indicated with coloring as in Figure 2.
(B) DNA bending observed in the IC structure. Ribbon representation of the IC LSP structure with mtRNAP and TFAM in the background and DNA in the foreground. Helices are depicted as cylinders. TFB2M was omitted for clarity. Approximate angles between DNA duplexes are indicated.
(C) Close-up view of the interaction between the PPR domain of mtRNAP and the upstream DNA duplex between the −10 and −15 bases. Several potentially interacting residues in the PPR domain are located close to the DNA backbone. In addition to two regions in the PPR domain (residues 220–222 and 252–255), R454 from the N-terminal domain of mtRNAP is located in proximity to the DNA. Note that the trajectories of sidechains shown are derived from the high-resolution structure of the EC used for molecular replacement (PDB ID 4BOC) (Schwinghammer et al., 2013).

