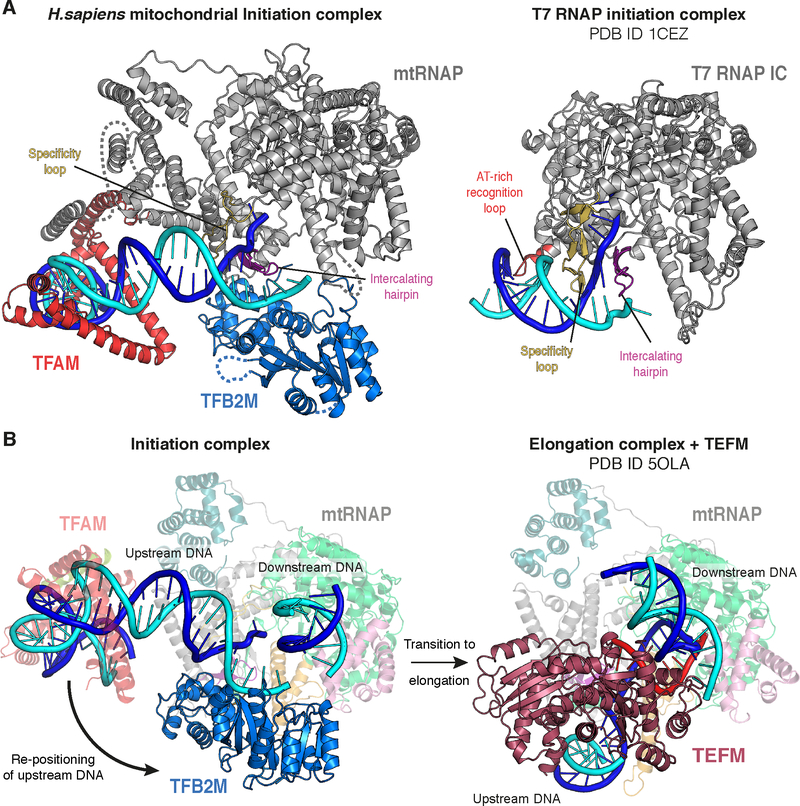
Figure 6 |. Comparison to T7 RNAP initiation and transition to elongation.
(A) (Left) Ribbon depiction of the LSP IC. MtRNAP is shown in grey with the intercalating hairpin in purple and the specificity loop in yelloworange. (Right) Ribbon depiction of the T7 RNAP initiation complex (PDB ID 1CEZ) (Cheetham et al., 1999). Coloring as for the mitochondrial IC, with the AT-rich recognition loop in red. The topology around the point of DNA melting is similar in both complexes. See also Figure S5.
(B) (Left) Structure of the LSP IC. TFAM and mtRNAP are depicted transparently for clarity. The movement of the upstream DNA upon transition to the EC is indicated with an arrow. (Right) Structure of the human mitochondrial transcription elongation complex with the elongation factor TEFM bound (PDB ID 5OLA) (Hillen et al., 2017).MtRNAP is depicted transparently for clarity. The position of the downstream DNA duplex is identical in both the IC and the EC. The TFB2M binding site on mtRNAP is occupied by the upstream DNA and TEFM in the EC, demonstrating that a pronounced rearrangement of the upstream DNA must take place during the transition from initiation to elongation and that binding of TFB2M and TEFM to mtRNAP are mutually exclusive.

