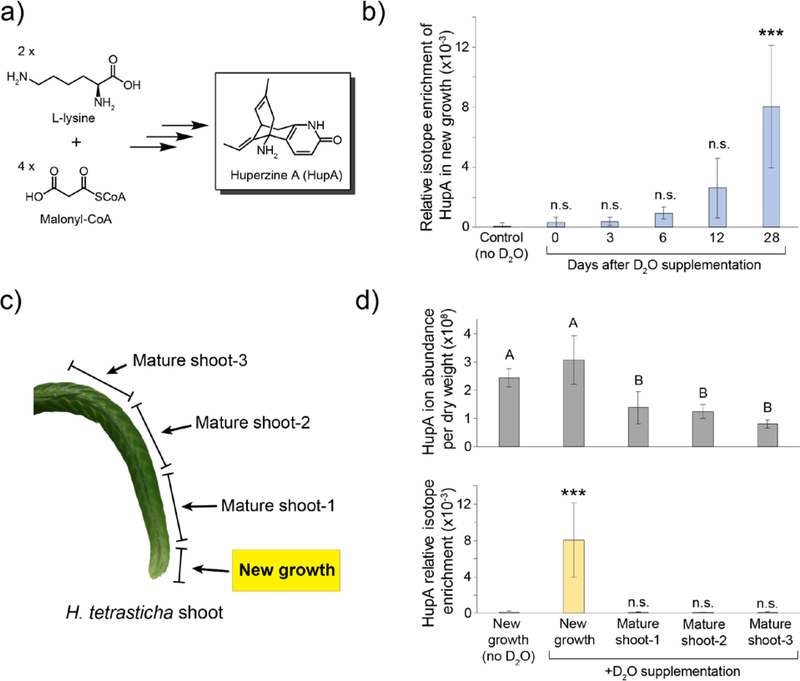
Figure 2. Analysis of HupA biosynthetic localization using deuterium labeling.
a) HupA is derived from L-lysine and malonyl-CoA, but the underlying biosynthesis remains unknown. b) Isotope enrichment of HupA over time in new growth. n=3–4 for each time point; Statistical significance determined using Dunnett’s test with comparison to the no D2O control, which was measured at the 28-day time point; *** = p<0.001, n.s. = not significant. c) HupA labeling was analyzed in different sections of the D2O-supplemented shoots to assess if biosynthesis is specific to a specific region of the shoot. d) Comparison of total HupA levels (top panel) in each tissue to the relative isotope enrichment (bottom panel) in new growth and in mature shoot tissue. n=3–7 per tissue; Statistical significance for the HupA content per tissue was performed using the Tukey-Kramer HSD test, with different letters indicating p<0.01. Statistical significance for isotope enrichment between tissues was determined using Dunnett’s test with comparison to the no D2O control; *** = p<0.001. Error bars on all graphs represent ± standard deviation.

