Figure 7.

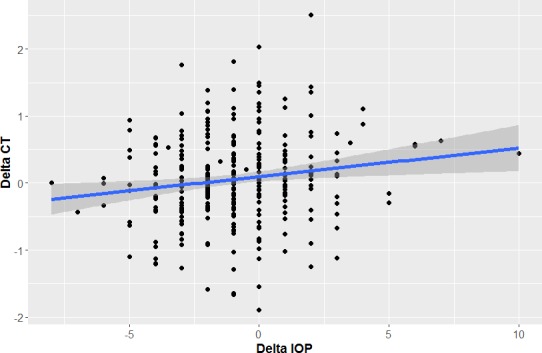
Relationship between CT and IOP changes. The decrease of CT correlates positively with the decrease of IOP. X-axis, Delta IOP (mm Hg); Y-axis, Delta CT (°C).

Relationship between CT and IOP changes. The decrease of CT correlates positively with the decrease of IOP. X-axis, Delta IOP (mm Hg); Y-axis, Delta CT (°C).