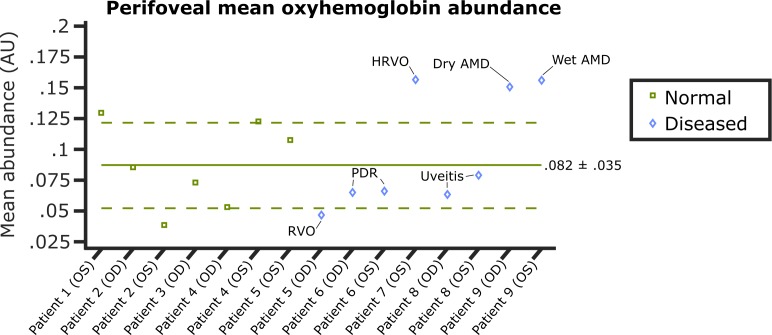
Figure 10.
A plot of perifoveal mean HbO2 abundance for patients 1 through 9. Green line, normal mean with sigma bounds. Green squares, healthy eye values. Blue diamonds, diseased eye values. Two healthy eyes, patients 1 (OS) and 2 (OS), fall outside the sigma bounds, whereas four diseased eyes fall outside.

