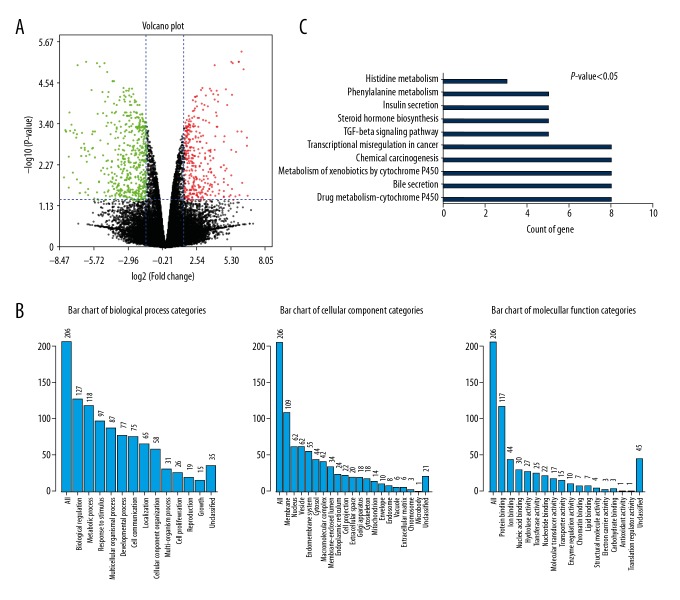
Figure 1.
Differential gene expression analysis between LNCaP and LNCaP-EnzaR cell lines. (A) Volcano plots were used to visualize the distribution of the DEGs. The red/green color of the symbols indicates the upregulated/downregulated DEGs that met the criteria (P<0.05, log2 |fold change| >1.5). (B) GO Slim summary based upon 206 DEGs. (C) Ten signaling pathways were associated with DEGs identified by enrichment analysis. The X-axis indicates the number of genes enriched in each pathway. DEG – differentially expressed gene; GO – gene ontology.

