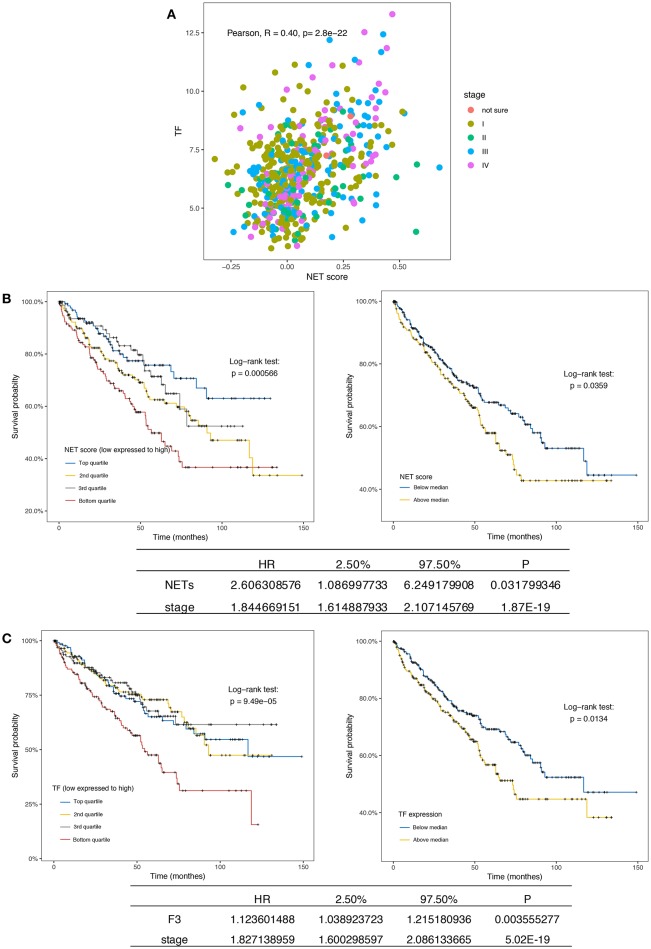
Figure 5.
NETs and F3 in tissues are independent prognostic factors in ccRCC patients. (A) Kaplan-Meier plots of the overall survival of ccRCC patients (n = 533) from the TCGA database stratified by the NET score quartile (left, p = 0.000566) and median NET score (right, p = 0.0359). The bottom list shows the adjusted HR for NETs by clinical stage (HR = 16.18). (B) Kaplan-Meier plots of the overall survival of ccRCC patients (n = 533) from the TCGA database stratified by the TF expression quartile (left, p = 0.49 × 10⁻⁵) and median TF expression value (right, p = 0.0134). The bottom list shows the adjusted HR for TF expression by clinical stage (HR = 1.12). (C) The NET score and TF expression value were positively correlated.

