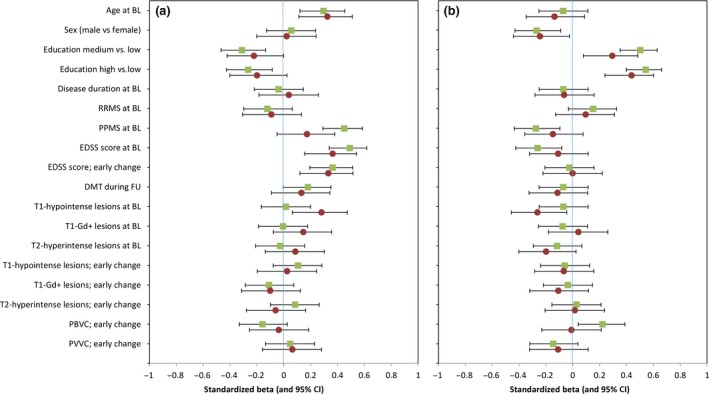
Figure 2.

Univariate analyses of predictors for disability and cognition after 6 and 12 years of follow‐up (FU). Visualization of univariate analyses of potential predictors for disability (a) and cognition (b). Standardized β and 95% confidence interval (CI) of all variables for the 6‐year FU (squares) and 12‐year FU (circles). BL, baseline; DMT disease‐modifying treatment; EDSS, Expanded Disability Status Scale; Gd+, gadolinium enhancing; PBVC, percentage brain volume change; PPMS, primary progressive multiple sclerosis; PVVC, percentage ventricular volume change; RRMS, relapsing‐remitting multiple sclerosis. [Colour figure can be viewed at wileyonlinelibrary.com]
