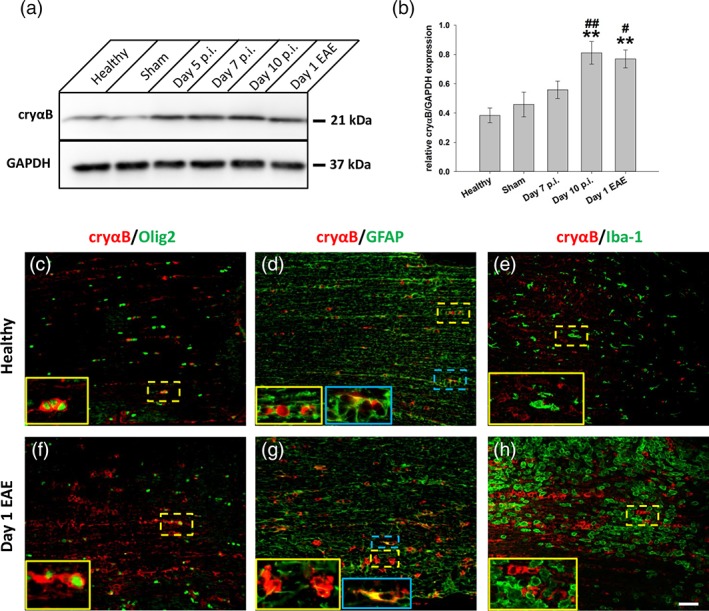
Figure 2.

αB‐crystallin expression increases throughout course of AON. (a) Western blot of optic nerve lysates from different time points throughout time‐course of AON using antibodies against αB‐crystallin (cryαB) and GAPDH. (b) Quantification revealed a two‐fold increase in cryαB starting already during the late induction phase of AON (day 10 p.i.; n = 4 pooled optic nerves per time point). (c–h) Immunostaining against cryαB with counterstaining for different glial cell markers, performed on optic nerve sections from healthy (c–e) and animals from day 1 of EAE (f–h). CryαB‐positive staining was mostly associated with oligodendrocytes (Olig2+ cells; c and f), whereas only modest co‐localization could be observed with GFAP+ astrocytes (d and g, blue inserts). No co‐localization could be observed with Iba‐1, a marker for microglia/macrophages (e and h). **p < .01 compared to healthy; and # p < .05, ##p < .01 compared to sham, ANOVA). Scale bar = 100 μm
