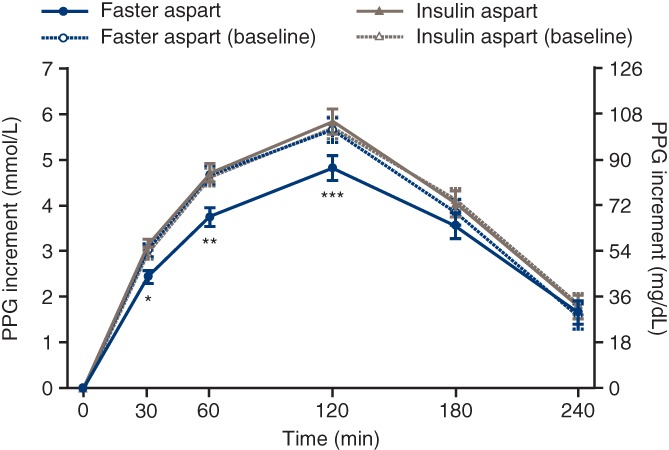
Figure 2.

Postprandial glucose (PPG) increment after a standardized meal test at baseline and week 16. Error bars: ± SE (mean). *Estimated treatment difference (ETD) at week 16: −0.66 mmol/L (95% confidence interval [CI] −1.00; −0.31] or −11.8 mg/dL (95% CI −18.1; −5.6; P < 0.001). **ETD at week 16: −0.91 mmol/L (95% CI −1.43; −0.39) or −16.4 mg/dL (95% CI −25.7; −7.1; P = 0.001). ***ETD at week 16: −0.90 mmol/L (95% CI −1.58; −0.22) or −16.2 mg/dL (95% CI −28.5; −4.0; P = 0.01). All available information regardless of treatment discontinuation was used. Faster aspart = fast‐acting insulin aspart
