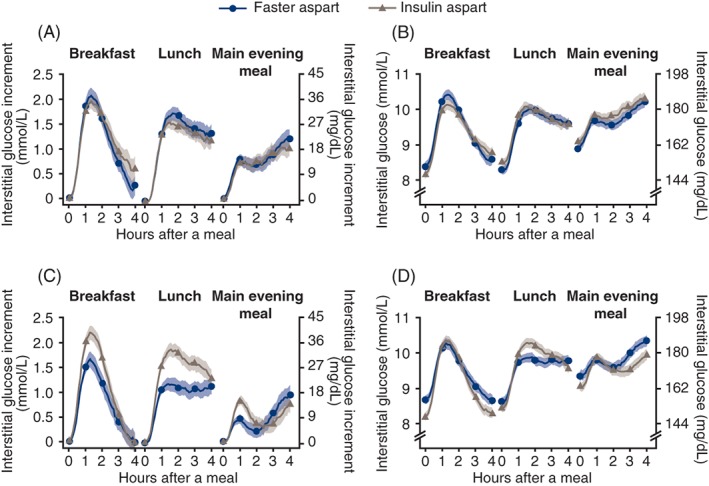
Figure 3.

Prandial interstitial glucose (IG) profiles. A and B, IG increment and IG at baseline. C and D, IG increment and IG at week 16. Error bars: ± SE (mean). Prandial IG increment is derived as the IG values subtracted by the mean of IG values within 15 minutes before the start of the meal. Meal times during the continuous glucose monitoring period were captured in participants' diaries. All available information regardless of treatment discontinuation was used. Faster aspart = fast‐acting insulin aspart
