

Abstract
Children undergoing cardiac surgery often receive acetaminophen (paracetamol) as part of their postoperative pain treatment. To date, there is no information on the pharmacokinetics (PK) of acetaminophen in this special population, even though differences, as a result of altered hemodynamics and/or use of cardiopulmonary bypass, may be anticipated. Therefore, the aim of this study was to investigate the PK of intravenous acetaminophen in children after cardiac surgery with cardiopulmonary bypass. In the study, both children with and without Down syndrome were included. A population PK analysis, using NONMEM 7.2, was performed based on 161 concentrations of acetaminophen, acetaminophen sulfate, acetaminophen glucuronide, and oxidative metabolites from 17 children with Down syndrome and 13 children without Down syndrome of a previously published study (median age, 177 days [range, 92–944], body weight, 6.1 kg [4.0–12.9]). All children received 3 intravenous acetaminophen doses of 7.5 mg/kg (<10 kg) or 15 mg/kg (≥10 kg) at 8–hour intervals after cardiac surgery. For acetaminophen and its metabolites, 1‐compartment models were identified. Clearance of acetaminophen and metabolites increased linearly with body weight. Acetaminophen clearance in a typical child of 6.1 kg is 0.96 L/h and volume of distribution 7.96 L. Down syndrome did not statistically significantly impact any of the PK parameters for acetaminophen, nor did any other remaining covariate. When comparing the PK parameters of acetaminophen in children after cardiac surgery with cardiopulmonary bypass with those from children of the same age following noncardiac surgery reported in the literature, clearance of acetaminophen was lower and volume of distribution higher.
Keywords: acetaminophen, cardiac surgery, cardiopulmonary bypass, Down syndrome, pediatrics, population pharmacokinetics
Congenital heart disease accounts for almost one‐third of all congenital defects.1 In many institutions around the world, children routinely receive acetaminophen (paracetamol) as part of their postoperative pain treatment.2
Acetaminophen is metabolized in the liver by various metabolic pathways.3 In adults, acetaminophen is mainly metabolized to acetaminophen glucuronide (55%) and acetaminophen sulfate (30%).4, 5, 6 To a small extent, acetaminophen is excreted unchanged in urine (2%–5%). Metabolism by cytochrome P450 accounts for 5% to 10% of the elimination, which is mediated primarily by cytochrome P450 2E1 to form the toxic metabolite N‐acetyl–p‐benzoquinone inine (NAPQI).4, 5, 6, 7, 8 Under normal conditions, NAPQI is immediately neutralized by conjugation with gluthatione.9 After formation of acetaminophen glutathione, both acetaminophen cysteine and acetaminophen mercapturate are formed. However, at high dosages, gluthatione will be depleted and NAPQI can result in hepatocellular necrosis.9
Several studies have reported on the pharmacokinetics (PK) of acetaminophen in infants and children.10, 11 However, there are no reports on the PK of acetaminophen in children after cardiac surgery with cardiopulmonary bypass. There are several reasons why children may have different PK after cardiac surgery compared to noncardiac surgery.12, 13 This can be ascribed not only to the altered hemodynamic situation of those children with cardiac anomalies, but also to the perioperative use of cardiopulmonary bypass, which has profound effects on the PK because of hemodilution, hemodynamic changes, hypothermia, systemic inflammatory response syndrome, and sequestration of drugs in the cardiopulmonary bypass system.13, 14 Additionally, as nearly half of children with Down syndrome have a congenital heart defect,15 they represent a relatively large subgroup in the population of children undergoing cardiac surgery. While differences in acetaminophen metabolism in adolescents and adults with and without Down syndrome have been suggested,16 this has not been studied in children.
Therefore, the aim of this study is to investigate the PK of acetaminophen and its metabolites in children after cardiac surgery with cardiopulmonary bypass. For this purpose, in blood samples from a previously published study on morphine PK and pharmacodynamics after cardiac surgery in children with and without Down syndrome17 acetaminophen concentrations were measured and data analyzed in relation to acetaminophen dosing information.
Methods
Patients, Study Design, and Drug Dosing
In this population PK study, blood samples on acetaminophen and metabolite concentrations were analyzed from a previously published prospective observational clinical study on analgesia and sedation in 38 children with and without Down syndrome who underwent cardiac surgery with cardiopulmonary bypass.17 The study design has been described in detail elsewhere17 and is summarized here as relevant for this analysis. The study was conducted at the Department of Anesthesia and Intensive Care Medicine of Our Lady's Children's Hospital, Dublin, Ireland, following approval by the ethical board of the hospital. Written informed consent for the study was obtained from parents preoperatively. Its primary aim was to compare the PK and pharmacodynamics of morphine and midazolam in children with and without Down syndrome after cardiac surgery with cardiopulmonary bypass, while intravenous acetaminophen was also administered to most of the patients. In the initial study, inclusion criteria for patients both with and without Down syndrome were age 3 to 36 months and cardiac surgery with cardiopulmonary bypass for atrial septal defect, ventricular septal defect, atrioventricular septal defect or tetralogy of Fallot repair. An additional inclusion criterion for the Down syndrome group was a diagnosis of trisomy 21.
Postoperatively, intravenous acetaminophen, administered as an infusion over 15 minutes, was given 3 times in a dose of 7.5 mg/kg (<10 kg) or 15 mg/kg (≥10 kg) at 8‐hour intervals according to the postoperative pain protocol. Scavenge blood samples from the subgroup receiving intravenous acetaminophen in the postoperative setting were used for the current study (n = 17 with Down syndrome; n = 13 without Down syndrome). Figure S1 provides plots of the spread in sampling times relative to the first paracetamol dose (Figure S1A) and relative to time after the most recent dose (Figure S1B). The number of samples in which acetaminophen and metabolite concentrations were measured ranged from 3 to 9 per patient. The PK model was based on 161 acetaminophen, 161 acetaminophen sulfate, 161 acetaminophen glucuronide, 161 acetaminophen cysteine, and 153 acetaminophen mercapturate concentrations. The clinical characteristics of the included patients (N = 30) are shown in Table 1.
Table 1.
Characteristics of 30 Children Included in the Current Analysis
| Variable | Children With Down Syndrome (n = 17) | Children Without Down Syndrome (n = 13) | P Value |
|---|---|---|---|
| Male | 7 (41) | 6 (46) | .79 |
| Gestational age, weeks | 39 [28–42] | 39.3 [35.5–41.0] | .16 |
| Age at surgery, days | 175 [105–944] | 175 [92–300] | .19 |
| Weight at surgery, kg | 6.1 [4.2–12.9] | 5.7 [4.0–8.2] | .18 |
| Procedure | <.001 | ||
| AVSD | 13 (76.5) | 1 (7.7) | |
| VSD | 4 (23.5) | 5 (38.5) | |
| TOF | 0 (0) | 7 (53.9) | |
| RACHS score | <.001 | ||
| 2 | 4 (23.5) | 12 (92.3) | |
| 3 | 13 (76.5) | 1 (7.7) | |
| CPB time, min | 111 [51–168] | 106 [61–105] | .89 |
| Aortic cross‐clamp time, min | 74.5 [27–118] | 66 [36–110] | .98 |
Values are presented as median [range] or N (%) unless specified otherwise.
ASD, atrial septal defect; AVSD, atrioventricular septal defect; CPB, cardiopulmonary bypass; RACHS, risk adjustment for congenital heart surgery; TOF, tetralogy of Fallot; VSD, ventricular septal defect.
Analytical Assay
Blood samples were centrifuged, and plasma was stored at –80°C for 2 years. Concentrations of acetaminophen and its metabolites, glucuronide, sulphate, gluthatione, cysteine, and mercapturate, were determined by ultra‐performance liquid chromatography and tandem mass spectrometry at the hospital pharmacy, Erasmus Medical Centre Rotterdam, The Netherlands.3
The assays were linear over 0.020 to 25.0 mg/L, 0.047 to 47.0 mg/L, and 0.043 to 43.0 mg/L for acetaminophen, acetaminophen glucuronide, and acetaminophen sulfate, respectively, and over 0.022 to 43.0 mg/L, 0.020 to 10.0 mg/L, and 0.010 to 15 mg/L for acetaminophen gluthation, acetaminophen cysteine, and acetaminophen mercapturate. The lower limit of the ranges represents the lower limits of quantification (LLOQ). Intra‐ and interassay accuracies ranged from 93.6% to 130.9%. Intra‐ and interassay imprecision did not exceed 15%.3
Population PK Analysis and Internal Validation
Acetaminophen and metabolite concentrations were analyzed using nonlinear mixed‐effect modeling software NONMEM version 7.2 (ICON Development Solutions, Ellicott City, Maryland) using the first‐order estimation method with the interaction option and subroutine ADVAN13, TOL4. Pirana (version 2.9.2), R (version 3.3.0), and PsN® version (version 4.4.8) software were used to process the runs and evaluate and visualize the data.
Concentrations were expressed in acetaminophen equivalents (mg/mL) via conversion based on molecular weights (acetaminophen = 151.165 g/mol; acetaminophen glucuronide = 349.271 g/mol; acetaminophen sulphate = 231.222 g/mol; acetaminophen cysteine = 254.304 g/mol; acetaminophen mercapturate = 296.341 g/mol).18, 19, 20, 21, 22 For acetaminophen, acetaminophen glucuronide, acetaminophen sulphate, and acetaminophen cysteine, 3 samples (1.08 %) were below LLOQ; and for acetaminophen mercapturate, 8 samples (4.88 %) were below LLOQ. These samples were excluded from the analysis. All acetaminophen glutathione concentrations were below LLOQ, and this metabolite was therefore not included in the model.
The model‐building process was performed in a stepwise manner: (1) the structural model, (2) the statistical model, (3) the covariate model, and (4) model evaluation.23 Discrimination between submodels was made by the likelihood ratio test using the objective function value (OFV) (ie, –2 log likelihood), where a decrease in OFV of 7.8 points (P < .005 based on an assumed χ2 distribution) was considered as statistically significant, between nested models with 1 degree of freedom. Furthermore, basic goodness‐of‐fit plots were evaluated, as well as precision of the parameter estimates and the condition number.
Structural and Statistical Model
One‐ and 2‐compartment PK models for acetaminophen and its metabolites were tested. To investigate a possible delay in metabolite formation, addition of transit compartments was tested. As acetaminophen cysteine and acetaminophen mercapturate are gluthation‐derived metabolites formed from the toxic NAPQI metabolite, the sum of both metabolite concentrations was modeled in 1 compartment, assuming the same distribution volume for both metabolites.24
For the metabolite model to be identifiable, it was assumed that the ratio of formation clearance of acetaminophen sulfate and acetaminophen glucuronide is the same in children between 3 and 9 years of age—namely, a fraction of 0.49 and 0.36 of total elimination acetaminophen clearance25—and that the oxidative metabolites and the unchanged clearance of acetaminophen are the same as in healthy adults, namely, 0.10 and 0.05 of the total acetaminophen clearance.4, 5, 6, 26
Interindividual variability on the model parameters was assumed to be log‐normally distributed and tested on all parameters. For the intraindividual variability and residual unexplained variability, a proportional, additive, and combined error model were tested.
Covariate Model
To evaluate the impact of growth and maturation on PK processes, body weight and age were tested as covariates. Additionally, tested covariates included sex, Down syndrome, cardiopulmonary bypass, and risk adjustment for congenital heart surgery (which quantifies the risk for in‐hospital mortality for pediatric patients undergoing cardiac surgery, with a value of 1 indicating the lowest risk and 6 the highest27). Continuous covariates were entered into the model using a linear or power equation (Equation 1).
| (1) |
In the equation, Pi represents the individual parameter estimates, θ1 and θ2 represent the typical parameter estimates for the covariate relationship, and COVi represents the covariate value for the individual, which is normalized by the median covariate value (COVmedian) representing the median value of the covariate. θ3 is an exponent fixed to 1 for a linear function or estimated for a power function. For the categorical covariates, such as Down syndrome and sex, the fractional change for one group compared to the other group was calculated.
A data‐driven covariate analysis was performed. Potential covariates were entered separately into the model and considered statistically significant when OFV decreased with at least 7.8 points (P < .005). When more than one significant covariate was identified, the covariate causing the largest drop in OFV was retained in the model and additional covariates had to reduce this OFV with the use of the same criteria to be retained in the model. In addition, it was evaluated whether the interindividual variability of the parameter was reduced upon inclusion of the covariate and the observations in the plot of eta versus covariate would be randomly spread around zero.
Internal Validation
A normalized prediction distribution error (NPDE) analysis was performed to evaluate the accuracy of the predictions of the median trend and variability in concentrations of acetaminophen, acetaminophen sulfate, acetaminophen glucuronide, and oxidative metabolites. In order to perform this analysis, the original data set was simulated 1000 times. Thereafter, each observed concentration was compared to the simulated concentrations by using the NPDE package in R.28
Comparison With Noncardiac Surgery
The results obtained in our study were compared to reported values for a similar population after noncardiac surgery. For this, the study by Prins et al29 was used, as to the best of our knowledge this is the only compartmental PK study using a similar population after noncardiac surgery. This study included 26 patients between 6 months and 2 years of age after craniofacial surgery. To illustrate the implication of the differences in parameter values, PK profiles for acetaminophen were generated upon a single dose of 7.5 mg/kg intravenous infusion (administration in 15 minutes) in a typical patient (body weight, 6.1 kg) after cardiac and noncardiac surgery.
Results
Population PK Analysis
Structural and Statistical Model
A 1‐compartment model for acetaminophen and a 1‐compartment model for acetaminophen sulfate, acetaminophen glucuronide, and the oxidative metabolites best fitted the data (Figure 1). Two‐compartment models for the distribution of acetaminophen and its metabolites did not statistically significantly improve the model fit. Interindividual variability could be identified for all parameters. A proportional error model best described residual variability for each of the compounds.
Figure 1.
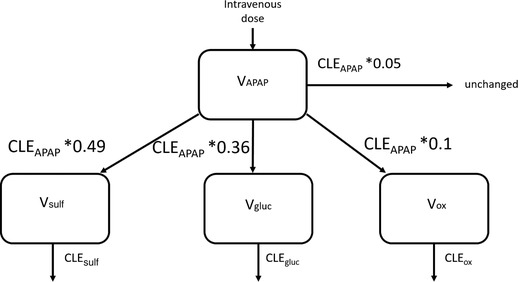
Schematic overview of the population pharmacokinetic model of acetaminophen (APAP) and its metabolites acetaminophen sulfate (sulf), acetaminophen glucuronide (gluc), and the combined oxidative cysteine and mercapturate metabolites (ox). V indicates distribution volume for the respective compounds, and CLE indicates the elimination clearance of the respective compound. Formation clearance of the metabolites and unchanged elimination clearance were calculated as fixed fractions of the elimination clearance of acetaminophen.
Covariate Model
In the covariate analysis, body weight was identified as a significant covariate. It was included in a linear relationship (Equation 1) on the total elimination clearance of acetaminophen (CLEAPAP) and its metabolites (CLEsulph, CLEgluc, CLEox). Including body weight in an exponential instead of linear relationship on elimination clearance of acetaminophen and its metabolites did not further improve the model. As formation of the metabolites is described as a fraction of the elimination clearance of acetaminophen, the linear relationship with body weight is perpetuated in these parameters (see Methods). For volume of distribution of acetaminophen, there was a trend toward a positive correlation with body weight; however, this relationship did not reach statistical significance probably because it relied mostly on the presence of 3 individuals with body weights outside the body weight range of the other individuals (Figure S2). In addition, body weight in a linear function on volume of distribution of the oxidative metabolites significantly decreased OFV. However, this covariate was not implemented, as the parameter value could not be estimated accurately (relative standard error [RSE], 161%) (Figure S2). No trends between body weight and volume of distribution were seen for acetaminophen sulfate and acetaminophen glucuronide. Differences between patients with or without Down syndrome were not observed at the various stages throughout the covariate analysis. Inclusion of any of the remaining covariates did not statistically significantly improve the model fit. All parameter estimates of the final model are shown in Table 2. From this table it is apparent that the parameter values could be accurately estimated (RSE generally ≤50%). Moreover, the residual variability was generally well below 15%.
Table 2.
Population Pharmacokinetic Parameters of the Final Pharmacokinetic Model for Acetaminophen and Its Metabolites in Children After Cardiac Surgery With Cardiopulmonary Bypass
| Parameter | Final Model (RSE%) [Shrinkage %] |
|---|---|
| Acetaminophen | |
| VAPAP (L) | 7.96 (10) |
| CLEAPAP = θ1 * (BW/6.1) + θ2 | |
| θ1 (L/h) | 1.50 (27) |
| θ2 (L/h) | –0.54 (61) |
| Acetaminophen sulfate | |
| Vsulf (L) | 0.68 (29) |
| CLEsulf = θ3 * (BW/6.1) + θ4 | |
| θ3 (L/h) | 0.65 (19) |
| θ4 (L/h) | –0.24 (35) |
| Acetaminophen glucuronide | |
| Vgluc (L) | 1.69 (29) |
| CLEgluc = θ5 * (BW/6.1) + θ6 | |
| θ5 (L/h) | 1.41 (21) |
| θ6 (L/h) | –0.53 (50) |
| Oxidative metabolites | |
| Vox (L) | 0.042 (18) |
| CLEox = θ7 * (BW/6.1) + θ8 | |
| Θ7 (L/h) | 40.86 (25) |
| Θ8 (L/h) | –1.26 (28) |
| Interindividual variability [ω2] | |
| VAPAP | 0.189 (27) [11] |
| CLEAPAP | 0.185 (27) [6] |
| Vsulf | 0.726 (52) [12] |
| CLEsulf | 0.189 (32) [6] |
| Vgluc | 0.927 (50) [15] |
| CLEgluc | 0.129 (39) [13] |
| Vox | 0.600 (49) [9] |
| CLEox | 0.552 (32) [9] |
| Residual variability [σ2] | |
| Proportional error for acetaminophen | 0.146 (29) [9] |
| Proportional error for acetaminophen sulfate | 0.0507 (15) [16] |
| Proportional error for acetaminophenglucuronide | 0.0813 (14) [15] |
| Proportional error for oxidative metabolites | 0.0494 (12) [16] |
See also Figure 1.
BW, body weight; CLEAPAP = CLfsulf + CLfgluc+ CLfox + ClfAPAP unchanged, where CLfsulf is formation clearance of acetaminophen sulphate, CLfgluc is formation clearance of acetaminophen glucuronide, and CLfox is formation clearance of oxidative metabolites; CLEgluc, elimination clearance of acetaminophen glucuronide; CLEox, elimination clearance oxidative metabolites; CLEsulph, elimination clearance of acetaminophen sulfate; Vgluc, central volume of distribution acetaminophen glucuronide; Vox, central volume of distribution oxidative metabolites; Vpcm, central volume of distribution of acetaminophen; Vsulf, central volume of distribution acetaminophen sulfate
Figure 2 presents the plots of observed versus population‐predicted concentrations of acetaminophen and its metabolites. These plots show no bias around the line of unity, indicating that the model accurately describes concentrations over the concentration range (Figure 2A): this is the same for children with and without Down syndrome. Similarly, the conditional weighted residuals over time after dose are unbiased for both subpopulations (Figure 2B), indicating that concentrations predictions are accurate over the entire time range.
Figure 2.
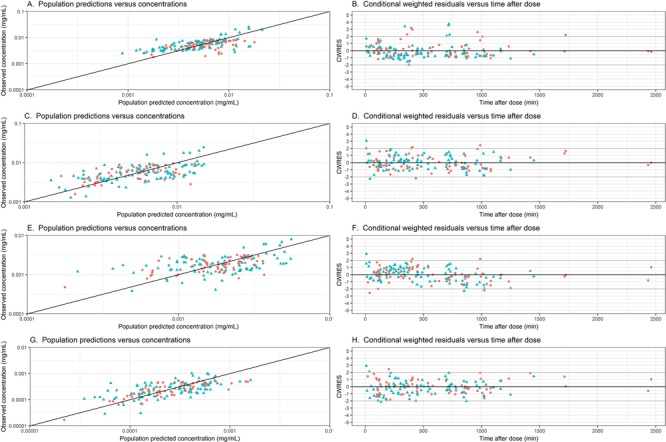
Observed vs population‐predicted concentrations and conditional weighted residuals (CWRES) versus time after dose graphs of acetaminophen (A, B), acetaminophen‐sulphate (C, D), acetaminophen‐glucuronide (E, F) and the oxidative metabolites (G, H) in the final model for children with (blue triangle) and without (red circle) Down syndrome.
Internal Model Validation
The NPDE distribution for acetaminophen and metabolites are depicted in Figure S3. The histograms of the NPDE follow a normal distribution. No trend is observed in the NPDE vs time and the NPDE vs predicted concentrations, confirming that the model adequately quantifies both the median trend and the variability in the observed concentrations.
Comparison With Noncardiac Surgery
For the typical child of 6.1 kg in our study, total elimination clearance and distribution volume of acetaminophen are 0.96 L/h and 7.96 L, respectively (Table 2). Prins et al29 reported a clearance value of 1.04 L/h and 2‐compartment distribution with volumes of 0.69 L and 3.80 L of the central and peripheral compartments, respectively, in the same typical child (6.1 kg) after noncardiac surgery. Figure 3 shows the population‐predicted acetaminophen concentrations after a single intravenous dose of 7.5 mg/kg of acetaminophen over 15 minutes in this typical individual after both types of surgery. The maximum concentration (Cmax) value for acetaminophen was 84% lower after cardiac surgery compared to after noncardiac surgery. In addition, maximum concentration shows a different shape of peak for the cardiac vs noncardiac surgery group, due to the use of a 2‐compartment model to describe PK of acetaminophen in the noncardiac surgery group. In addition, because the clearance of acetaminophen was lower after cardiac surgery compared to noncardiac surgery, the trough level at 8 hours was more than a factor 50 higher in this typical patient, compared to a typical patient after noncardiac surgery.
Figure 3.
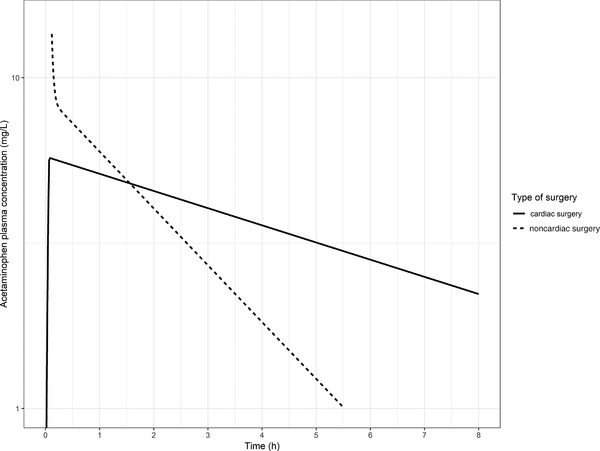
Acetaminophen concentrations over time in a typical child of 6.1 kg upon a single intravenous dose of 7.5 mg/kg after cardiac surgery (solid black line) and noncardiac surgery (dotted black line).
Discussion
The present study investigated the PK of acetaminophen and its metabolites in children after cardiac surgery with cardiopulmonary bypass, using a population PK modeling approach. Contrary to a previous report,16 no differences in PK parameters were observed between children with or without Down syndrome; therefore, these data were combined.
Although the study sample size may be considered limited, the advantage of population PK modeling is that all concentration‐time data are analyzed together, thereby enhancing the statistical power.12, 29 Indeed, the RSEs of the parameter estimates obtained in this analysis show that these values could be obtained with acceptable precision given the available data. Furthermore, extensive model validation showed that the model not only describes the obtained data well (Figure 2) but also predicts the data well (Figure S3).
In our study, the clearance of acetaminophen and metabolites was found to increase with body weight, which was found to be a better descriptor of the impact of maturational changes than age, which is in line with other studies.30 However, it is important to mention that the model was developed based on data from children aged between 3 months and 3 years, with a body weight ranging between 4.0 and 12.9 kg. As many developmental changes occur in children younger and older than this age range, extrapolation outside this age range is not justified as the linear function in this covariate relationship is only appropriate in the studied age range.30
Due to differences in parameterization and covariate relationships, direct comparisons between literature values are difficult; however, comparisons between parameter values for typical individuals are possible. A previous study on the PK of acetaminophen after noncardiac surgery29 reported for a child weighing 6.1 kg a clearance value of 1.04 L/h, which is higher in comparison with our estimate in post‐cardiopulmonary bypass cases (0.96 L/h). In our analysis, we identified a 1‐compartment model, while in patients after noncardiac surgery 2 compartments were identified. Although our analysis included observed concentrations shortly after dosing (Figure S1), it is possible that this was not sufficient to identify 2 compartments. Alternatively, differences in the impact of the 2 surgery types on patients’ physiology may cause true differences in the distribution of acetaminophen. Either way, the combined central and peripheral volume of distribution after noncardiac surgery (4.49 L for a 6.1‐kg child) was lower in comparison with the total volume of distribution found in our analysis in children after cardiac surgery (7.96 L for a 6.1‐kg child). The differences in clearance and volume of distribution may be attributed to the influence of cardiopulmonary bypass causing hemodynamic changes and fluid shifts, while the occurrence of inflammation or systemic inflammatory response syndrome may also impact metabolic capacity.12, 13
To allow for a further comparison of the differences in the PK of acetaminophen after cardiac and noncardiac surgery, Figure 3 displays PK profiles of a typical individual of 6.1 kg after both types of surgery. This figure shows that maximum concentration is lower after cardiac surgery compared to noncardiac surgery, while the through level at 8 hours is higher in patients after cardiac surgery. Whether these differences also result in different dose requirements depends on the relationship between exposure and efficacy and safety parameters in both populations. This is part of further investigations.
A strength of our analysis is the inclusion of both acetaminophen and its metabolites. However, as no study in noncardiac surgery patients investigated all metabolites, no comparison between cardiac and noncardiac pediatric surgery patients can be made regarding the PK of the metabolites.
Interestingly, oxidation of acetaminophen has been suggested to be increased in adolescents and adults with Down syndrome,16 which was not observed in the current (younger) patient population. In our model, all parameters were estimated with high accuracy and the same set of model parameters could be used to predict acetaminophen and metabolite concentrations without bias in both subpopulations. The previously observed findings could be artifacts resulting from a smaller sample size (4 individuals [mean age, 20.8 [range, 20–21] years) with Down syndrome and 4 individuals (25.4 [18–32]) without Down syndrome and from performing a noncompartmental analysis. In our study, we were not able to detect NAPQI and acetaminophen gluthatione, likely because NAPQI is immediately neutralized by conjugation to gluthathione. When conjugation occurs, downstream metabolites will not be formed and, consequently, cannot be measured. In the absence of the occurrence of NAPQI in the blood, no conclusions can be drawn on a possible difference in the saturation process of NAPQI between children with and without Down syndrome. As we studied acetaminophen in the therapeutic range and the above‐mentioned process occurs only with higher doses, we do not expect that this phenomenon occurred. In addition, to the best of our knowledge there are no published reports linking Down syndrome with any differences in the risk of developing acetaminophen‐related hepatotoxicity.
There are some limitations to our study. In the absence of recovery of all of the metabolites in urine, assumptions were necessary to quantify PK parameters of the metabolites. We chose to fix the fraction eliminated through each pathway based on published values,25 as there is no reason to assume that contributions of the different metabolic pathways of acetaminophen are altered after cardiac surgery. This also means that the maturation identified on total paracetamol clearance is assumed to be the same for both metabolic pathways. Although model validation confirmed that the model can accurately describe concentrations of acetaminophen and its metabolites with the estimated model parameters, if the true fractions for each route deviate from the assumed fractions in children after cardiac surgery with cardiopulmonary bypass, the elimination clearance and distribution volume of the metabolites would change. This means that absolute values of the parameters related to the metabolites should be considered only in the context of the assumptions made. Our ability to investigate differences in acetaminophen PK between children with and without Down syndrome is not impacted by our assumptions, as a fractional difference between the groups could still be tested as a covariate on all model parameters.
Conclusions
In conclusion, we report the PK of acetaminophen in infants undergoing cardiac surgery. Comparing the results with those reported in children with noncardiac surgery, clearance of acetaminophen is decreased while volume of distribution is increased in children after cardiac surgery with cardiopulmonary bypass. In this population, Down syndrome does not impact the PK of acetaminophen.
Supporting information
Figure S1. Bar plots of number of samples taken at different time intervals relative to the first acetaminophen dose given upon arrival at the Intensive care unit (A) and relative to time after the most recent acetaminophen dose (B).
Figure S2. Eta values for volume of distribution of acetaminophen (A) and oxidative metabolites (B) vs body weight in the final model.
Figure S3. Normalized prediction distribution error (NPDE) of the final model for acetaminophen (A), acetaminophen sulfate (B), acetaminophen glucuronide (C), and the oxidative metabolites (D). The histograms of NPDEs, with the observed frequency of sample quantiles of the NPDEs (white bars), overlaid with the density of the standard normal distribution (blue bars) (left graphs). NPDE vs time, with the NPDE for each observation (dots), and the lines indicate the mean (red) and the 90% percentiles (blue) of the NPDEs, and the shaded areas are the simulated 90% confidence intervals of the NPDE median (red) and 95th percentiles (blue) (middle graphs). NPDE vs predicted concentration, with dots and lines as described for the middle graphs (right graphs).
Author Contributions
P.M. analyzed data and wrote paper; A.J.V. conceived and designed the study, performed research, and wrote paper; K.A. wrote paper; B.C.P.K. wrote paper and analyzed blood samples; C.V.B. conceived and designed the study, performed research, and wrote paper; C.A.J.K. wrote paper; D.T. conceived and designed the study and wrote paper; E.H.J.K. supervised, analyzed data, and wrote paper.
Declaration of Conflicting Interests
The authors declare no conflict of interest.
Funding
P. Mian was supported by the Sophia Stichting Wetenschappelijk Onderzoek (SSWO) (S16‐08).
Data Sharing
For questions concerning data sharing, please contact A.J. Valkenburg (A.Valkenburg@erasmusmc.nl).
References
- 1. van der Linde D, Konings EE, Slager MA, et al. Birth prevalence of congenital heart disease worldwide: a systematic review and meta‐analysis. J Am Coll Cardiol. 2011;58(21):2241–2247. [DOI] [PubMed] [Google Scholar]
- 2. Zeilmaker‐Roest GA, Wildschut ED, van Dijk M, et al. An international survey of management of pain and sedation after paediatric cardiac surgery. BMJ Paediatr Open. 2017;1(1):e000046. [DOI] [PMC free article] [PubMed] [Google Scholar]
- 3. Flint RB, Mian P, van der Nagel B, Slijkhuis N, Koch BC. Quantification of acetaminophen and its metabolites in plasma using UPLC‐MS: doors open to therapeutic drug monitoring in special patient populations. Ther Drug Monit. 2017;39(2):164–171. [DOI] [PubMed] [Google Scholar]
- 4. Prescott LF. Kinetics and metabolism of paracetamol and phenacetin. Br J Clin Pharmacol. 1980;10(suppl 2):291S–298S. [DOI] [PMC free article] [PubMed] [Google Scholar]
- 5. Clements JA, Critchley JA, Prescott LF. The role of sulphate conjugation in the metabolism and disposition of oral and intravenous paracetamol in man. Br J Clin Pharmacol. 1984;18(4):481–485. [DOI] [PMC free article] [PubMed] [Google Scholar]
- 6. Critchley JA, Nimmo GR, Gregson CA, Woolhouse NM, Prescott LF. Inter‐subject and ethnic differences in paracetamol metabolism. Br J Clin Pharmacol. 1986;22(6):649–657. [DOI] [PMC free article] [PubMed] [Google Scholar]
- 7. Rumack BH. Acetaminophen hepatotoxicity: the first 35 years. J Toxicol Clin Toxicol. 2002;40(1):3–20. [DOI] [PubMed] [Google Scholar]
- 8. Manyike PT, Kharasch ED, Kalhorn TF, Slattery JT. Contribution of CYP2E1 and CYP3A to acetaminophen reactive metabolite formation. Clin Pharmacol Ther. 2000;67(3):275–282. [DOI] [PubMed] [Google Scholar]
- 9. Forrest JAH, Clements JA, Prescott LF. Clinical pharmacokinetics of paracetamol. Clin Pharmacokinet. 1982;7(2):93–107. [DOI] [PubMed] [Google Scholar]
- 10. Zuppa AF, Hammer GB, Barrett JS, et al. Safety and population pharmacokinetic analysis of intravenous acetaminophen in neonates, infants, children, and adolescents with pain or fever. J Pediatr Pharmacol Ther. 2011;16(4):246–261. [DOI] [PMC free article] [PubMed] [Google Scholar]
- 11. Wang C, Allegaert K, Tibboel D, et al. Population pharmacokinetics of paracetamol across the human age‐range from (pre)term neonates, infants, children to adults. J Clin Pharmacol. 2014;54(6):619–629. [DOI] [PubMed] [Google Scholar]
- 12. Zeilmaker GA, Pokorna P, Mian P, et al. Pharmacokinetic considerations for pediatric patients receiving analgesia in the intensive care unit; targeting postoperative, ECMO and hypothermia patients. Expert Opin Drug Metab Toxicol. 2018:14(4):417–428. [DOI] [PubMed] [Google Scholar]
- 13. van Saet A, de Wildt SN, Knibbe CA, Bogers AD, Stolker RJ, Tibboel D. The effect of adult and pediatric cardiopulmonary bypass on pharmacokinetic and pharmacodynamic parameters. Curr Clin Pharmacol. 2013;8(4):297–318. [DOI] [PubMed] [Google Scholar]
- 14. Hall RI. Cardiopulmonary bypass and the systemic inflammatory response: effects on drug action. J Cardiothorac Vasc Anesth. 2002;16(1):83–98. [DOI] [PubMed] [Google Scholar]
- 15. Fudge JC Jr, Li S, Jaggers J, et al. Congenital heart surgery outcomes in Down syndrome: analysis of a national clinical database. Pediatrics. 2010;126(2):315–322. [DOI] [PMC free article] [PubMed] [Google Scholar]
- 16. Griener JC, Msall ME, Cooke RE, Corcoran GB. Noninvasive determination of acetaminophen disposition in Down's syndrome. Clin Pharmacol Ther. 1990;48(5):520–528. [DOI] [PubMed] [Google Scholar]
- 17. Valkenburg AJ, Calvier EA, van Dijk M, et al. Pharmacodynamics and pharmacokinetics of morphine after cardiac surgery in children with and without Down syndrome. Pediatr Crit Care Med. 2016;17(10):930–938. [DOI] [PubMed] [Google Scholar]
- 18. PubChem . Paracetamol sulfate. https://pubchem.ncbi.nlm.nih.gov/compound/Paracetamol_sulfate#section=Top. Accessed November 18, 2017.
- 19. PubChem . Acetaminophen. https://pubchem.ncbi.nlm.nih.gov/compound/acetaminophen. Accessed November 18, 2017.
- 20. PubChem . Acetaminophen glucuronide. https://pubchem.ncbi.nlm.nih.gov/compound/Paracetamol_glucuronide. Accessed November 18, 2017.
- 21. PubChem . Paracetamol mercapturate. https://pubchem.ncbi.nlm.nih.gov/compound/171471. Accessed November 18, 2017.
- 22. PubChem . Acetaminophen cysteine. https://pubchem.ncbi.nlm.nih.gov/compound/Acetaminophen_cysteine. Accessed November 18, 2017.
- 23. Nguyen TH, Mouksassi MS, Holford N, et al. Model evaluation of continuous data pharmacometric models: metrics and graphics. CPT Pharmacometrics Syst Pharmacol. 2017;6(2):87–109. [DOI] [PMC free article] [PubMed] [Google Scholar]
- 24. Owens KH, Murphy PG, Medlicott NJ, et al. Population pharmacokinetics of intravenous acetaminophen and its metabolites in major surgical patients. J Pharmacokinet Pharmacodyn. 2014;41(3):211–221. [DOI] [PubMed] [Google Scholar]
- 25. Miller RP, Roberts RJ, Fischer LJ. Acetaminophen elimination kinetics in neonates, children, and adults. Clin Pharmacol Ther. 1976;19(3):284–294. [DOI] [PubMed] [Google Scholar]
- 26. Sivilotti ML, Juurlink DN, Hanly L, Lenga I, Garland JS, Thompson M. Massive acetaminophen overdose treated with immediate hemodialysis: is the antidote removed faster than the toxin? Clin Toxicol. 2012;50(7):577. [Google Scholar]
- 27. Jenkins KJ, Gauvreau K. Center‐specific differences in mortality: preliminary analyses using the risk adjustment in congenital heart surgery (RACHS‐1) method. J Thorac Cardiovasc Surg. 2002;124(1):97–104. [DOI] [PubMed] [Google Scholar]
- 28. Comets E, Brendel K, Mentre F. Computing normalised prediction distribution errors to evaluate nonlinear mixed‐effect models: the npde add‐on package for R. Comput Methods Programs Biomed. 2008;90(2):154–166. [DOI] [PubMed] [Google Scholar]
- 29. Prins SA, Van Dijk M, Van Leeuwen P, et al. Pharmacokinetics and analgesic effects of intravenous propacetamol vs rectal paracetamol in children after major craniofacial surgery. Paediatr Anaesth. 2008;18(7):582–592. [DOI] [PubMed] [Google Scholar]
- 30. De Cock RF, Piana C, Krekels EH, Danhof M, Allegaert K, Knibbe CA. The role of population PK‐PD modelling in paediatric clinical research. Eur J Clin Pharmacol. 2011;67(suppl 1):5–16. [DOI] [PMC free article] [PubMed] [Google Scholar]
- 31. Mahmood I. Prediction of drug clearance in children from adults: a comparison of several allometric methods. Br J Clin Pharmacol. 2006;61(5):545–557. [DOI] [PMC free article] [PubMed] [Google Scholar]
Associated Data
This section collects any data citations, data availability statements, or supplementary materials included in this article.
Supplementary Materials
Figure S1. Bar plots of number of samples taken at different time intervals relative to the first acetaminophen dose given upon arrival at the Intensive care unit (A) and relative to time after the most recent acetaminophen dose (B).
Figure S2. Eta values for volume of distribution of acetaminophen (A) and oxidative metabolites (B) vs body weight in the final model.
Figure S3. Normalized prediction distribution error (NPDE) of the final model for acetaminophen (A), acetaminophen sulfate (B), acetaminophen glucuronide (C), and the oxidative metabolites (D). The histograms of NPDEs, with the observed frequency of sample quantiles of the NPDEs (white bars), overlaid with the density of the standard normal distribution (blue bars) (left graphs). NPDE vs time, with the NPDE for each observation (dots), and the lines indicate the mean (red) and the 90% percentiles (blue) of the NPDEs, and the shaded areas are the simulated 90% confidence intervals of the NPDE median (red) and 95th percentiles (blue) (middle graphs). NPDE vs predicted concentration, with dots and lines as described for the middle graphs (right graphs).