
Figure 3.
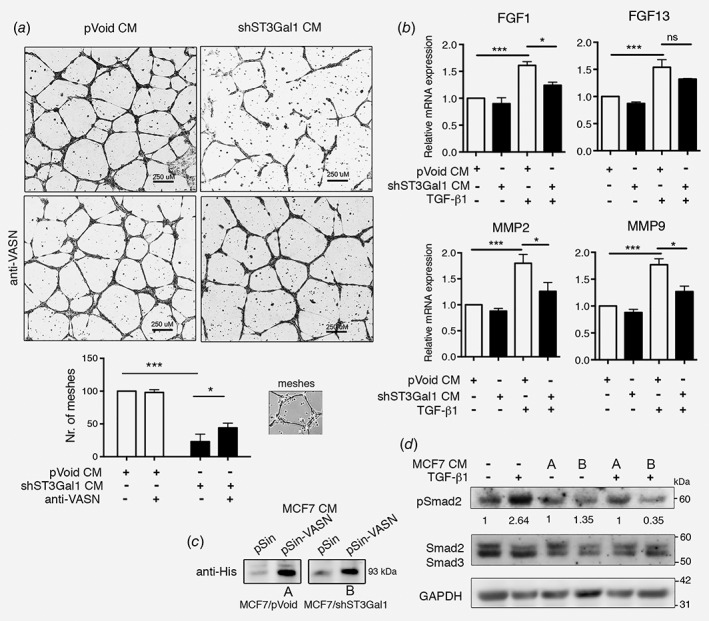
Effects of α2,3 sialylated VASN on HUVEC tube formation, and TGF‐β1 mediated angiogenesis and signaling pathway. (a) Representative phase contrast images of tube formation by HUVECs suspended in 50% CM from MCF7/shST3Gal1 or MCF7/pVoid stable clones, with or without anti‐VASN (upper panel). Scale bar = 250 μm. Numbers of meshes (as illustrated in inserts) were quantified using ImageJ software (lower panel; n = 3). Results are represented as means (SD). Data are analyzed by Student's t‐test (*p < 0.05, ***p < 0.001). (b) RT‐PCR analysis of angiogenesis related genes in HUVEC after treated with TGF‐β1 and CM from MCF7 stable clones. (c) WB analysis of VASN in CM after transfection of the an empty vector or pin‐VASN‐His into MCF7/pVOID (A) and MCF7/shST3Gal1 (B). (d) WB analysis of the protein extracts of HUVEC treated with CM from VASN over‐expression in MCF7/pVoid (A) and MCF7/shST3Gal1 (B) in the present of TGF‐β1 for 1 h, GAPDH was used as control. In c‐d, western blotting was performed with the indicated antibodies. WB, western blot; CM, conditioned media.