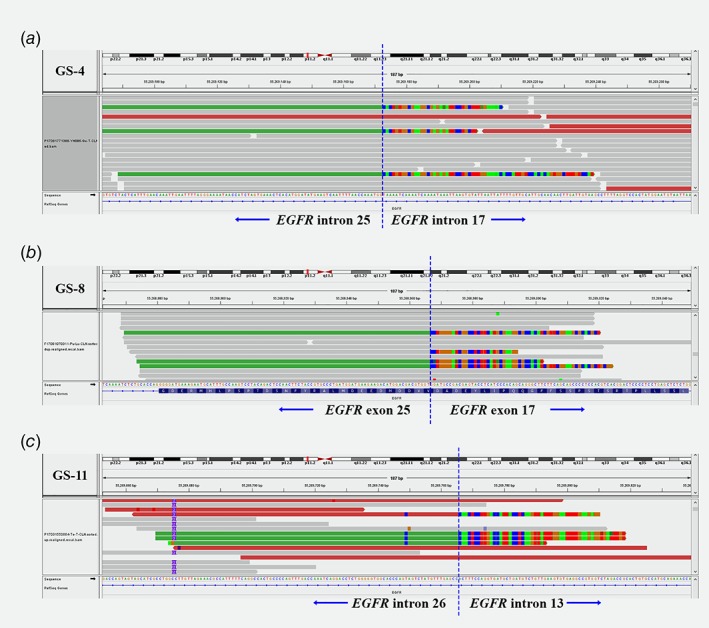
Figure 1.

Visualization of EGFR‐KDD variants using the IGV Browser. The bottom of each panel consists of the EGFR reference sequence with nucleotides shown. Blue vertical dashed lines indicate where the breakpoints were localized. KDD events include canonical exon 18–25 duplications in GS‐4 (a), and uncommon ones, such as exons 17–25 in GS‐8 (b) and exons 14–26 in GS‐11 (c).
