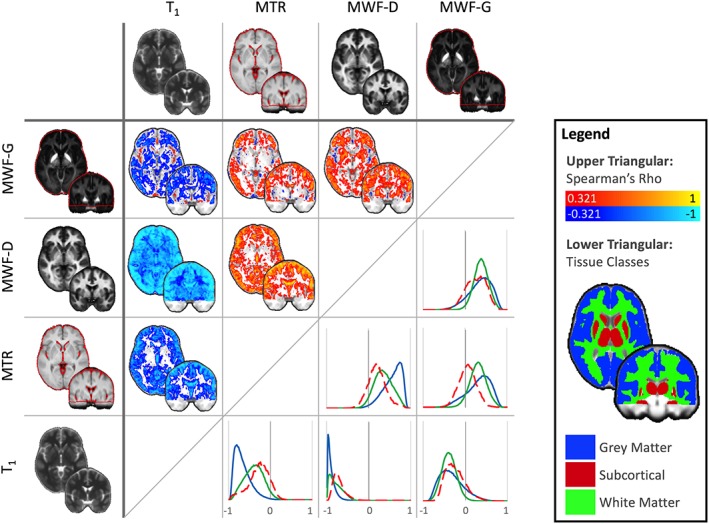
Figure 3.

Cross‐sectional Spearman's rank correlations between quantitative techniques, calculated for every voxel (upper triangular) in the healthy control cohort. Normalized histograms of the voxelwise correlations are also plotted according to tissue class (lower triangular, correlation coefficient value bins on the x‐axis) with subcortical structures (red mask/dashed line), white matter (green mask/line), and gray matter (blue mask/line). Images are shown thresholded for visualization only at ρ > 0.321 or ρ < 0.321, p < 0.05 (two‐tailed, uncorrected). Raw unthresholded volumes are available as supplementary material. Images are shown in MNI space on a coronal Y = −2 and an axial slice Z = −2 [Color figure can be viewed at http://wileyonlinelibrary.com]
