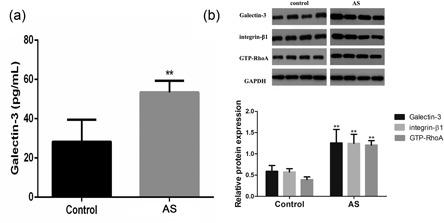
Figure 1.

Protein expression of Gal‐3, integrin β1, RhoA, GTP‐RhoA in AS and some paired normal segments. (a) ELISA was used to detect the level of Gal‐3 in plasma. (b) Protein expression of Gal‐3, integrin β1 and GTP‐RhoA was assessed by WB and the relative protein expression was further indicated using histograms. **p < 0.01 versus control
