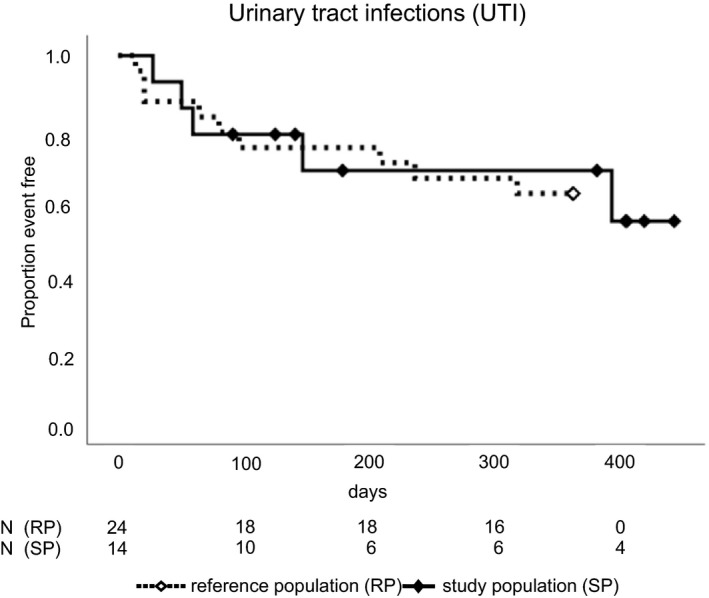
Figure 5.

Bacterial urinary tract infections. Kaplan–Meier curves for the study population (SP) vs the matched reference population (RP). “Proportion of event free” refers to urinary tract infections, dropping out, and end of study in the SP, but to urinary tract infections alone in the RP; P = .81 by log rank test. N, number of patients
