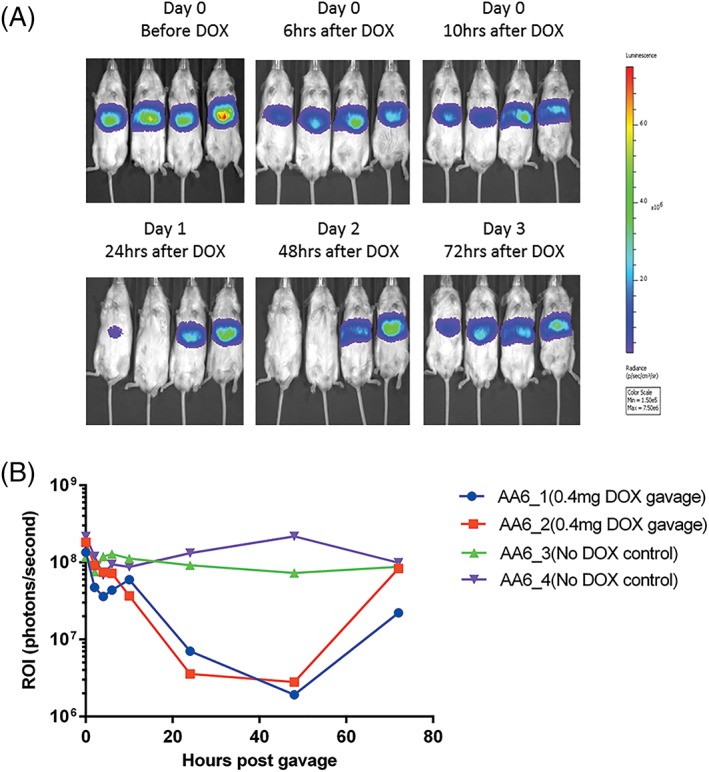
Figure 4.

In vivo imaging of mice injected with 1.6 × 10¹⁰ vg/mouse AAV8‐Tetoffbidir‐Alb‐luc vector. (A) Optical CCD images for luciferase expression of mice before and after doxcycline induction. Left to right: AA6_ 1 and AA6_2: Gavaged with 0.4 mg of doxycycline. AA6_3 and AA6_4: Controls without doxycycline. (B) Luciferase expression was quantified and represented as photons/second of the ROI
