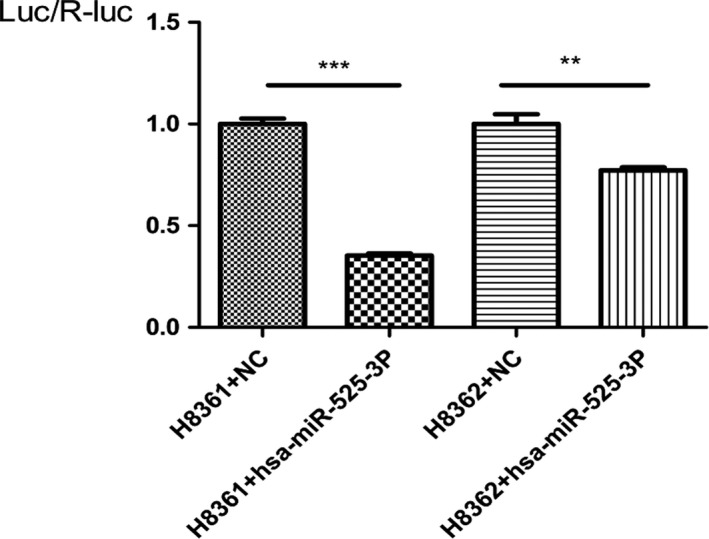
Figure 4.

Results of luciferase reporter assay in HEK 293T cells with co‐transfection of 3′‐UTR vector or NC vector. The bar graph shows the mean ± s.d. in the three independent experiments. One‐way ANOVA and Bonferroni test are carried out to determine significant differences in luciferase activity (***p < 0.001 and **p < 0.01). SEMG1: semenogelin 1; NC: negative control; s.d.: standard deviation.; H8361: Wild‐type pMIR‐REPORT ‐ SEMG1 ‐ 3′UTR; H8362: mutant pMIR‐REPORT ‐ SEMG1 ‐ 3′UTR.
