Figure 2.

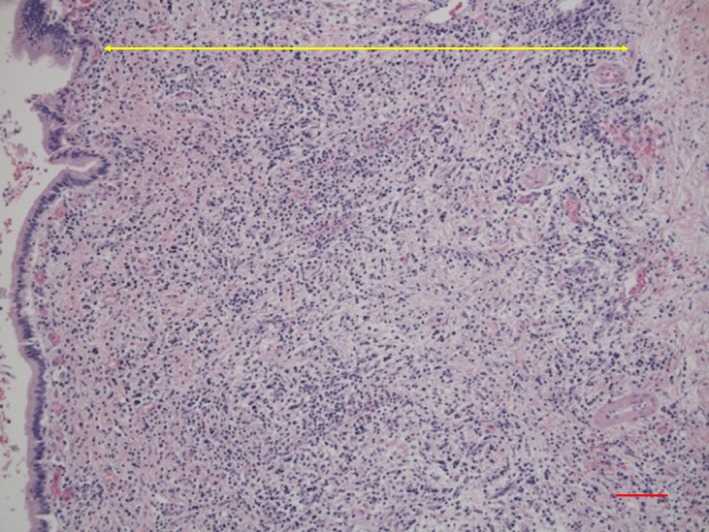
Histological findings of transmural inflammatory cell infiltration and fibrosis in the bile duct of IgG4‐SC (arrow). (Scale: 100 μm)

Histological findings of transmural inflammatory cell infiltration and fibrosis in the bile duct of IgG4‐SC (arrow). (Scale: 100 μm)