Figure 15.

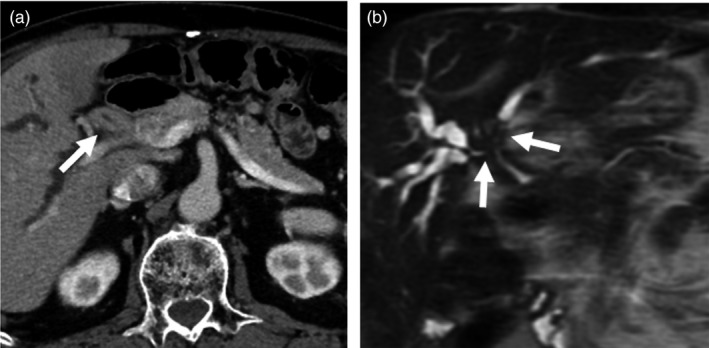
CT and MRCP images of IgG4‐SC. (a) In CT, the hilar bile duct shows marked thickening (arrow). (b) MRCP demonstrates bile duct strictures in the hilar bile duct (arrows)

CT and MRCP images of IgG4‐SC. (a) In CT, the hilar bile duct shows marked thickening (arrow). (b) MRCP demonstrates bile duct strictures in the hilar bile duct (arrows)