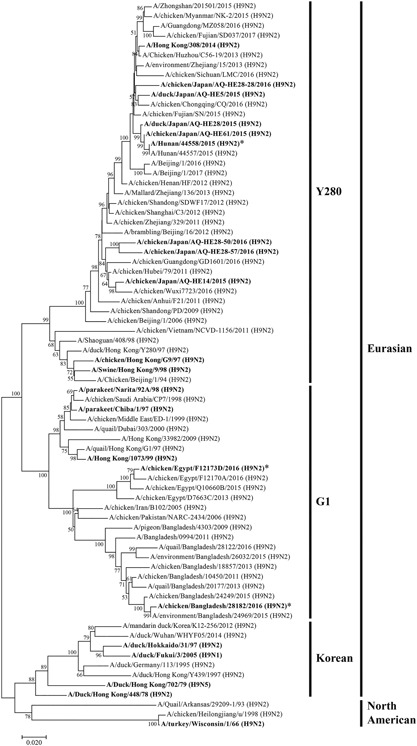
Figure 1.

Phylogenetic tree for the H9 HA genes. The tree was constructed using the neighbor‐joining method with MEGA7 software. Evolutionary distances were computed using the Kimura two‐parameter method. The percentage of replicate trees in which the associated taxa clustered together in the bootstrap test (1000 replicates) and values of more than 50% are shown next to the branches. The viruses used in this study are shown in bold. *Viruses for which in vitro‐transcribed RNA was used for rRT‐PCR
