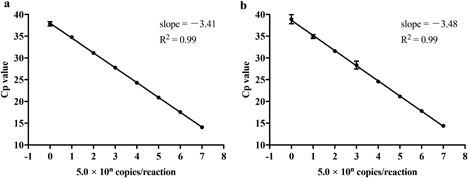
Figure 2.

Dynamic range of the H9 rRT‐PCR assay. Standard curve (crossing point [Cp] value vs log10 concentration) for serial dilutions of in vitro‐transcribed RNA of the HA gene of (a) A/Hunan/44558/2015 (H9N2), Y280 lineage and (b) A/chicken/Egypt/F12173D/2016 (H9N2), G1 lineage. The standard curve was generated using the average Cp values obtained from six replicates. The correlation coefficient (R 2) and slope of the standard curve are shown in each graph
