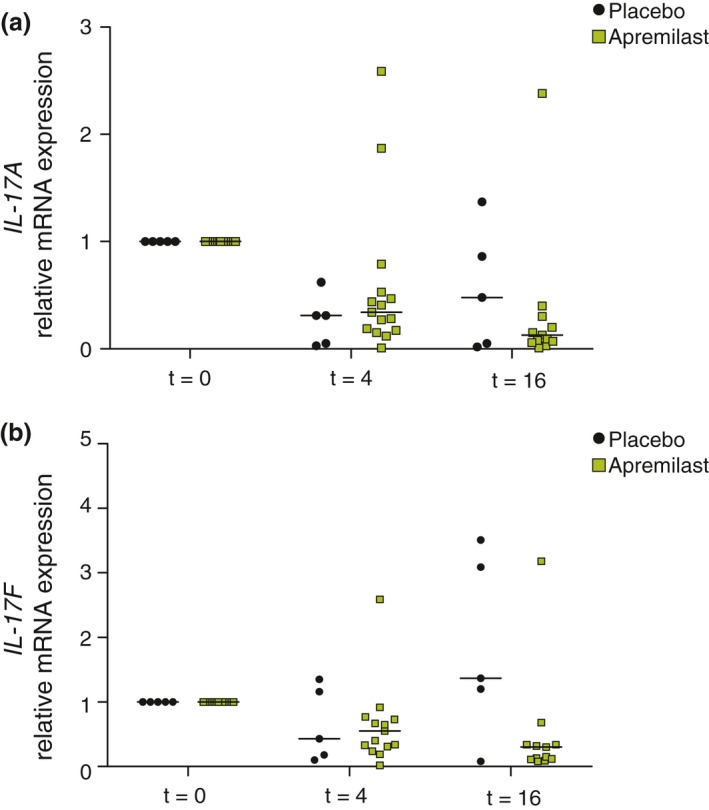
Figure 3.

Relative mRNA expression levels of IL‐17A and IL‐17F in patients receiving apremilast (n = 15) and placebo (n = 5). IL: interleukin; t: week. Panel (a; above) IL‐17A. At t = 16 in the apremilast group: one data point is out of the y‐axis range. Linear mixed effect model: P > 0.05. Panel (b; below). IL‐17F. At both t = 4 and t = 16 in the apremilast group, one data point is out of the y‐axis range. Linear mixed effect model: P > 0.05. Data at week 16 for two patients receiving apremilast are missing as these two patients discontinued after respectively week 4 and week 8.
