
Figure 3.
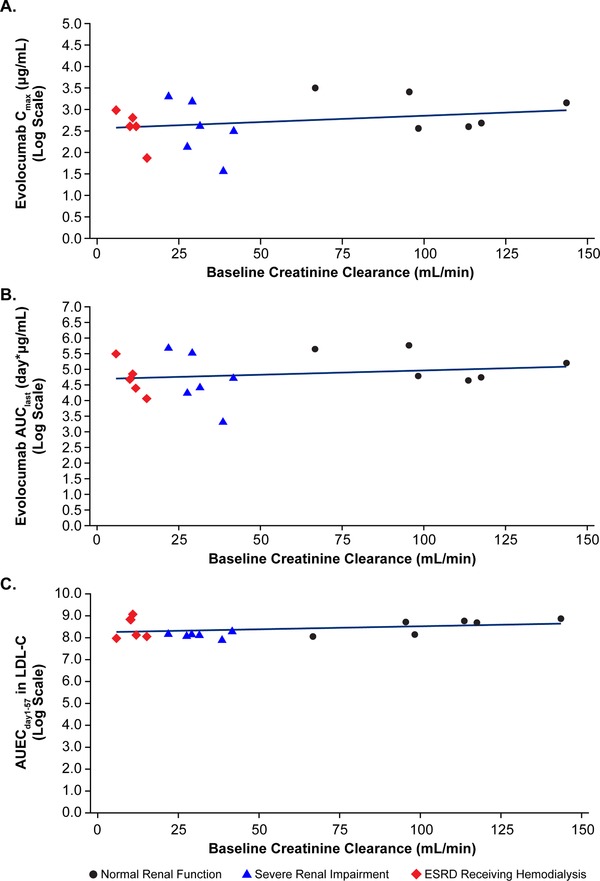
Scatterplots of individual log‐transformed values for (A) Cmax, (B) AUClast, and (C) AUECday1‐57 for LDL‐C versus baseline CrCl with regression line. AUClast, area under the drug concentration‐time curve from time zero to time of last quantifiable concentration; AUECday1‐57, area under the effect‐time curve from day 1 to 57; Cmax, maximum observed drug concentration; CrCl, creatinine clearance; ESRD, end‐stage renal disease; LDL‐C, low‐density lipoprotein cholesterol.