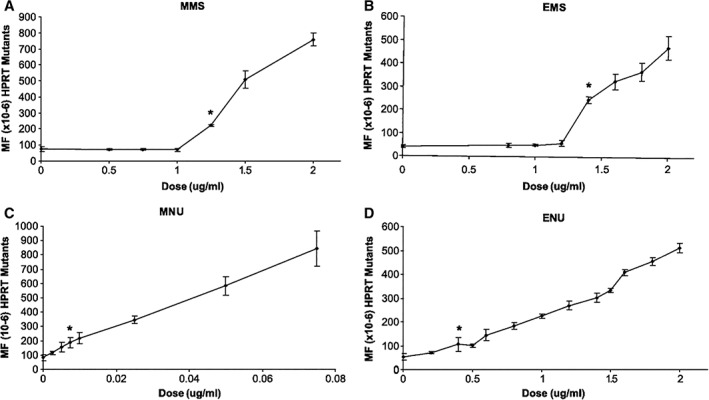
Figure 3.

Reprinted (with permission) from Doak et al., 2007: “Figure 1. Influence of MMS (A), EMS (B), MNU (C), and ENU (D) dose upon micronucleus frequency in the AHH‐1cell line. Points, mean of treatments done in duplicate; bars, SD. *, the first statistically significant increases in chromosome damage at 0.85 μg/mL MMS (A), 1.40 μg/mL EMS (B), 0.15 μg/mL MNU (C), and 0.50 μg/mL ENU (D); %Mn/Bn, percentage of binucleated cells containing one or more micronuclei.”
