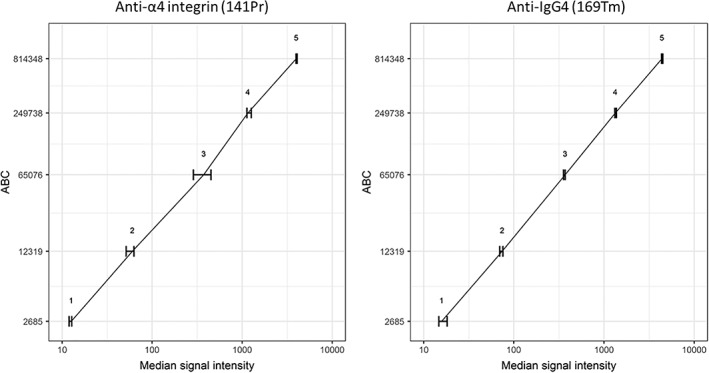
Figure 3.

Median signal intensity of anti‐α4 integrin (141Pr) and anti‐IgG4 (169Tm) on QSC beads with known antibody binding capacity (ABC). Error bars show the range of measured signal intensities in three replicate experiments. The same data for each of the experiments are shown in Supporting Information Figure. S2b.
