
Figure 7.
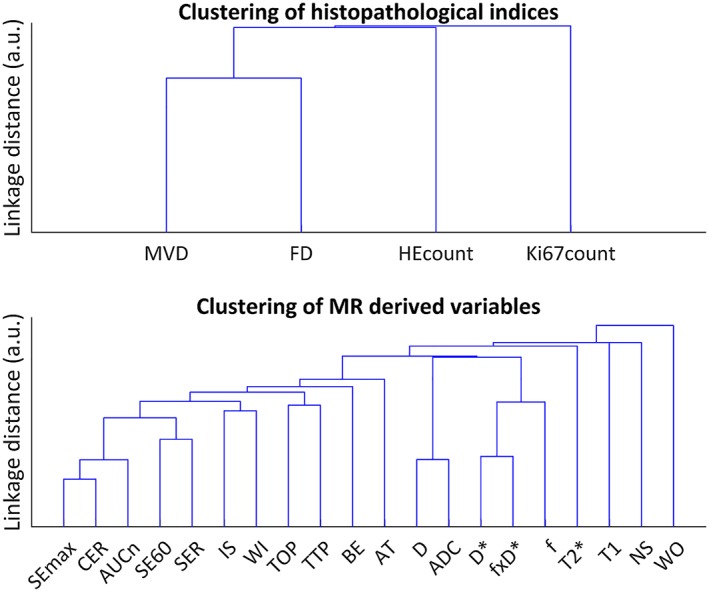
Dendrogram of the cluster analysis of the histological indices (upper), and MR derived parameters (lower)
Official websites use .gov
A
.gov website belongs to an official
government organization in the United States.
Secure .gov websites use HTTPS
A lock (
) or https:// means you've safely
connected to the .gov website. Share sensitive
information only on official, secure websites.
Dendrogram of the cluster analysis of the histological indices (upper), and MR derived parameters (lower)