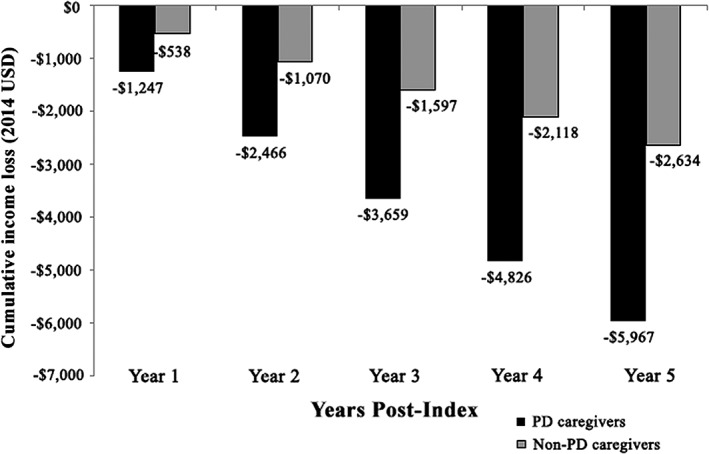
Figure 2.

Regression‐adjusted cumulative income loss for PD caregivers versus matched controls.a‐d PD, Parkinson's disease; USD, United States dollars. aThe study period for each patient was index date to the earliest date of end of eligibility, end of continuous employment, or until the patient was age 65 (maximum follow‐up of 5 years). bEmployer‐reported annualized income (including wage and salary, and excluding variable components such as equity options) available in the eligibility records for each patient were used. Employees’ income for each calendar year of observation was calculated as the average of the annualized employer‐reported income reported at each month of the corresponding calendar year in the database. Income was adjusted for inflation to 2014 USD using the Consumer Price Index from the Bureau of Labor Statistics. cThe regression model used was a generalized linear mixed model with a gamma distribution and log link, which accounted for the correlation in income between the PD caregivers and their matched controls as well as the correlation within patients because of the repeated measures of income. dThe regression‐adjusted annual income presented here represents geometric means to account for the skewness of income distribution. These were calculated by taking the average of the ln (annual income) across patients, then exponentiating this average.
