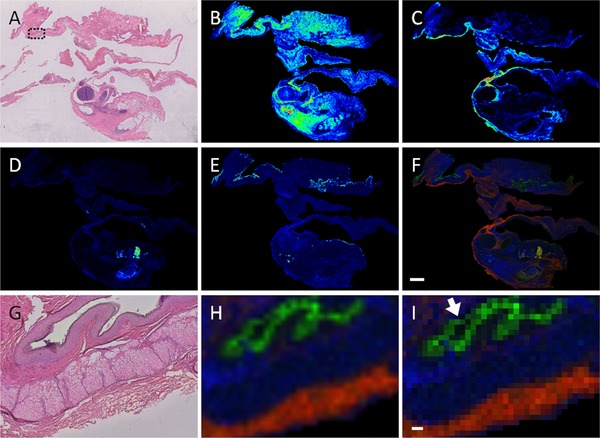
Figure 3.

MALDI–MSI of human ovarian teratoma. A) Post‐measurement stained H&E human teratoma. B) MALDI–MSI image of m/z 1249.2 corresponding to smooth muscle and glands; (C; m/z 1095.7), connective tissue, (D; m/z 1127.7) mucus, and (E) m/z 1324.63 shows epidermal stratum corneum layer. F) Overlay image of the preceding ion images showing the individual localization of the ion images. Scale bar indicates 2 mm. G) Higher magnification of H&E stained sample; region indicated by dotted black box in panel (A). H) Overlay image of corresponding region from panel (G) shows the discrete localizations of the ion signals. I) Image of corresponding region with pixels representing individual MALDI spectra. In this view, it is possible to see that some ion signals are limited to a 50 µm region (arrow). Scale bar indicates 100 µm.
