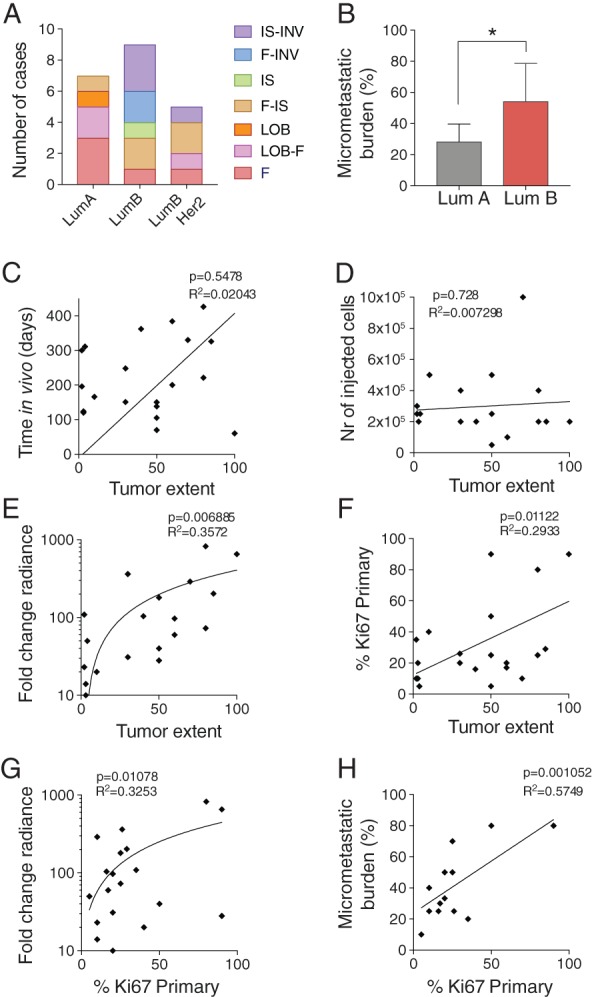
Figure 3.

Characterization of in vivo growth. (A) Distribution of histological patterns within each subtype. (B) Micrometastatic burden expressed as percentage of positive organs in each recipient in luminal A‐ (LumA) versus luminal B‐ (LumB) derived PDXs. (C–F) Pearson correlation of tumor extent against (C) time of PDX growth in vivo, expressed in days after injection, (D) initial number of cells injected per gland, (E) in vivo cell growth expressed as fold‐change radiance relative to the first day of measurement (log10) and (F) Ki67 index of the primary tumor. (G and H) Pearson correlation of primary tumor Ki67% with (G) in vivo monitored growth and with (H) micrometastatic burden the percentage of organs affected by metastases within each case as determined by bioluminescence.
