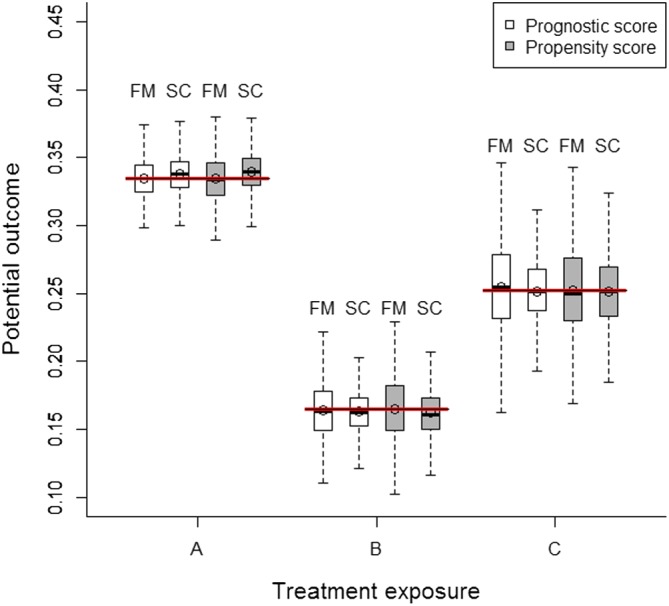
Figure 1.

Distribution of estimated potential outcomes after conditioning on the prognostic score and effect modifier, and the propensity score. Red bold lines (ie, reference values) correspond to the expected values of potential outcomes obtained in an independent “superpopulation” including 5 000 000 individuals. FM, full matching; SC, subclassification [Colour figure can be viewed at wileyonlinelibrary.com]
