
Figure 1.
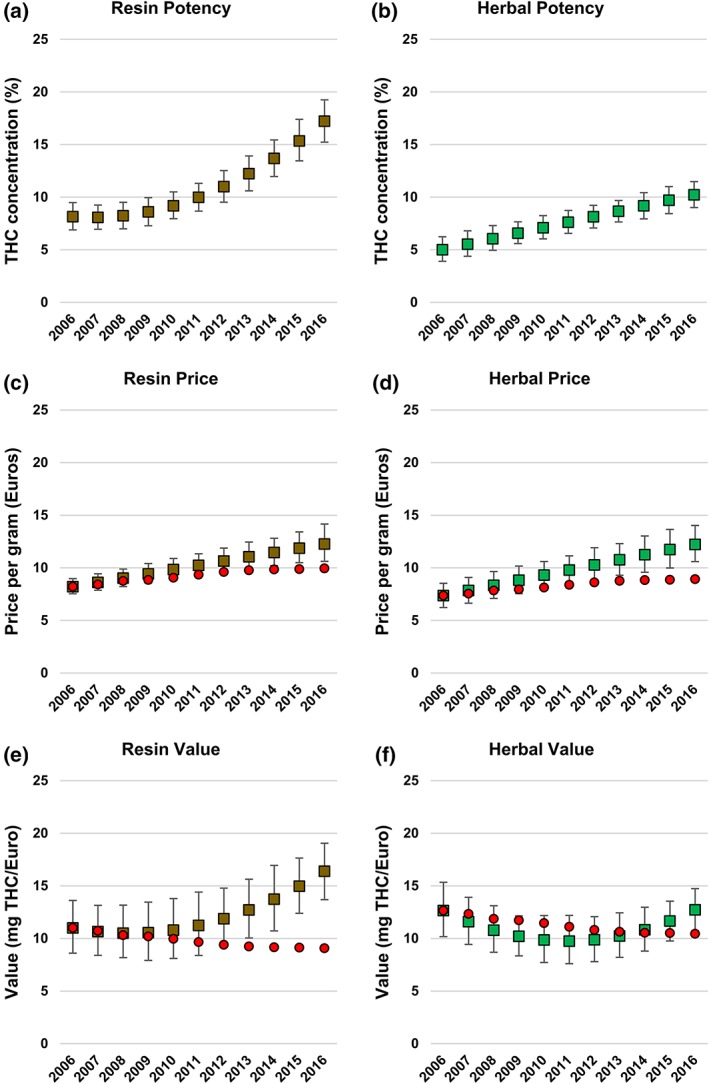
Changes in cannabis potency, price and value in Europe by year, 2006–16. Data shown are mean [± 95% confidence intervals (CIs)] observed values and are unadjusted for inflation. Red circles show expected price changes based on inflation alone. (a) Potency of cannabis resin, (b) potency of herbal cannabis, (c) price per gram of cannabis resin, (d) price per gram of herbal cannabis, (e) value of cannabis resin, (f) value of herbal cannabis. [Colour figure can be viewed at wileyonlinelibrary.com]