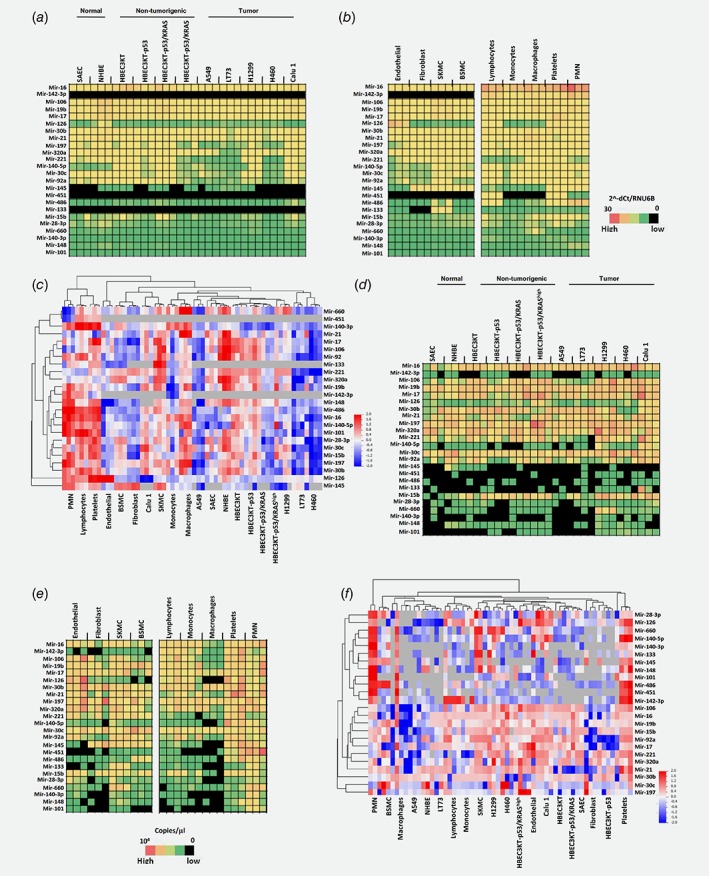
Figure 1.

miRNA expression and release profiles across different cell types of lung microenvironment. Heatmaps showing levels of miRNA expression in lung epithelial (a) or stromal (b) cells. (c) Bi‐cluster of intracellular microRNA expression. Heatmaps describing miRNAs secretion in conditioned medium of lung epithelial (d) or stromal (e) cells. (f) Hierarchical clustering of microRNAs secreted by different cell types. Black boxes indicate no miRNA detection. Cellular expression profiles were performed using qPCR whereas miRNA secretion using digital PCR (n = 3 replicates for each cell types). [Color figure can be viewed at wileyonlinelibrary.com]
