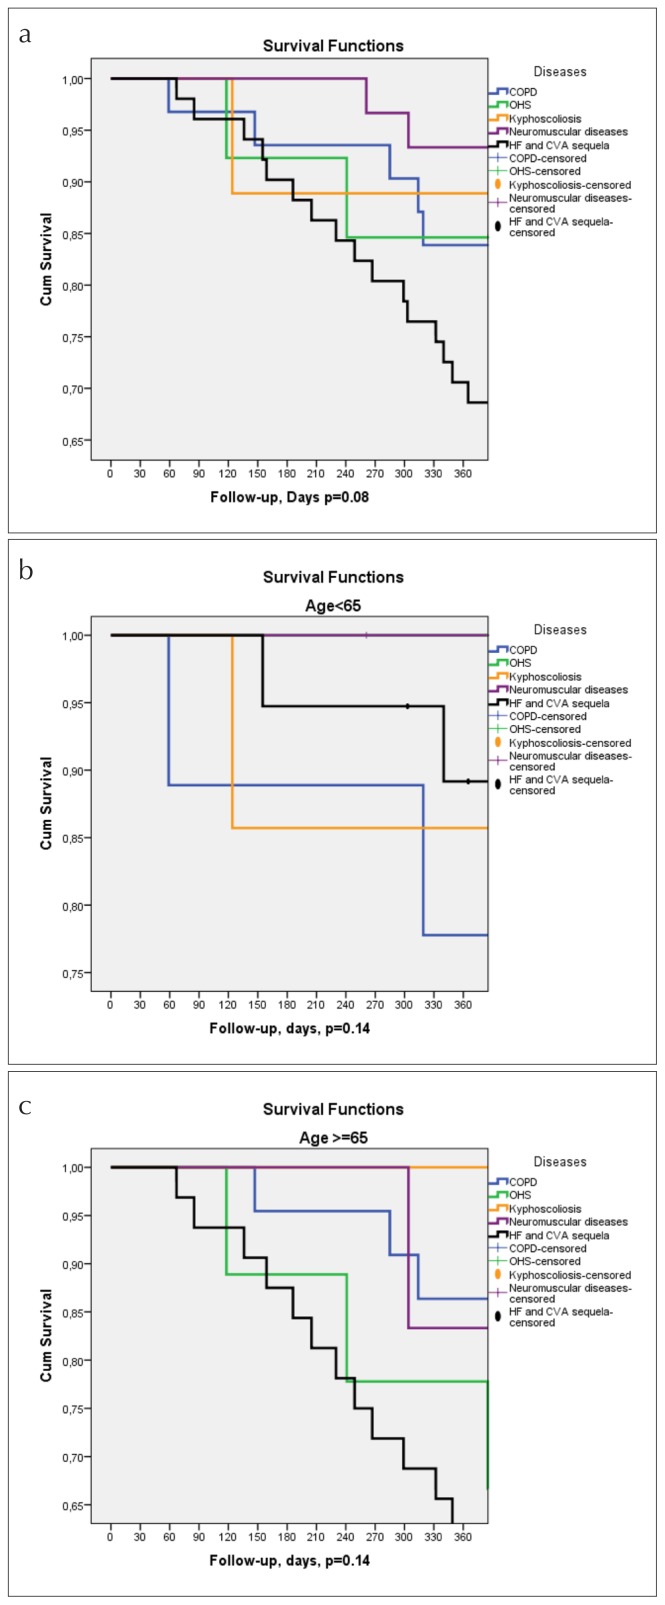
Figure 3. a–c.
(a) Kaplan Meier Survival curves for all patients with different diseases in one year follow-up period. (b) Kaplan Meier Survival curves for patients under 65 age with different diseases in one year follow-up period. (c) Kaplan Meier Survival Curves for patients’ age 65 and above with different diseases in one year follow-up period

