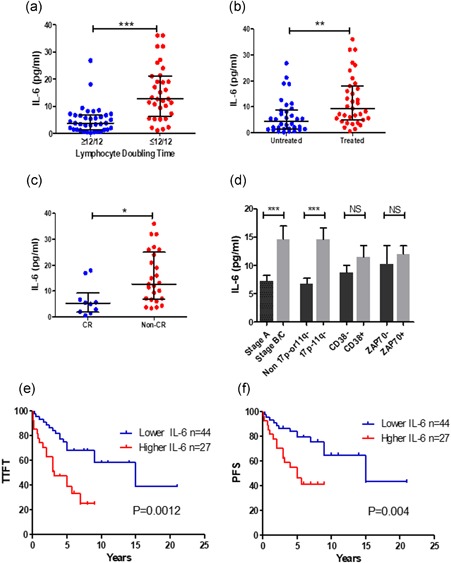
Figure 1.

The association of autocrine IL‐6 with clinical outcome in patients with CLL. Autocrine IL‐6 production was determined by IL‐6 ELISA kit after 5 × 10⁶/ml cells were cultured for 24 hr. Levels of autocrine IL‐6 production were compared in (a) LDT ≥ 12/12 (n = 38) vs. LDT ≤ 12⁄12 (n = 34), (b) treated (n = 35) vs. untreated (n = 34) groups, (c) patients with CR (n = 10) vs. non‐CR (n = 25), (d) other prognostic markers. Data were analyzed by the Mann–Whitney test. *p < 0.05, **p < 0.01, and ***p < 0.001. NS means not significant. (e) Time to the first treatment (TTFT) and (f) Progress‐free survival (PFS) of patients with CLL based on of patients with low autocrine IL‐6 (<9.35 pg/ml) and high IL‐6 (>9.35 pg/ml). Cut‐off point was obtained by the X‐tile software. CLL: chronic lymphocytic leukemia; CR: complete remission; ELISA: enzyme‐linked immunosorbent assay; IL‐6: interleukin 6; LDT: lymphocyte doubling time [Color figure can be viewed at wileyonlinelibrary.com]
