Figure 4.

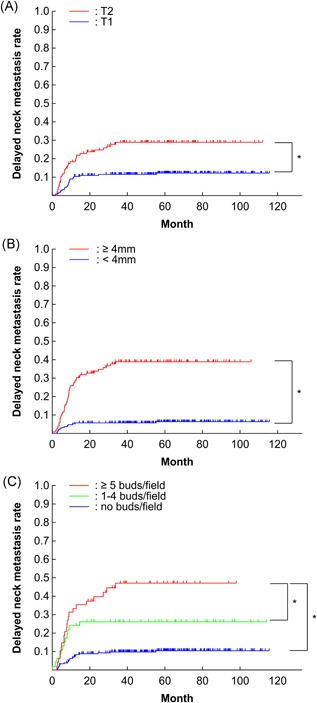
(A) Kaplan‐Meier curves for delayed neck metastatic rate according to T classification, B, depth of invasion, and C, tumor budding. *P < 0.05 [Color figure can be viewed at wileyonlinelibrary.com]

(A) Kaplan‐Meier curves for delayed neck metastatic rate according to T classification, B, depth of invasion, and C, tumor budding. *P < 0.05 [Color figure can be viewed at wileyonlinelibrary.com]