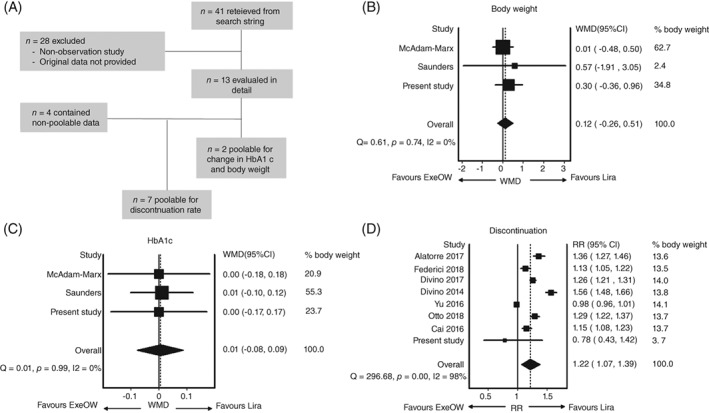
Figure 2.

Meta‐analysis of observational studies comparing exenatide OW (ExeOW) and liraglutide (Lira). A, The meta‐analysis flowchart. Panels B‐D show the forest plots for the 3 outcomes considered: B, change in HbA1c, C, change in body weight and D, discontinuation rates. In the paper by McAdam‐Marx et al.,13 unadjusted data were recorded for the change in HbA1c and body weight, and, for the change in HbA1c, only the insulin‐free subgroup was considered. In the paper by Otto et al.,15 cohort 1 was considered, which was composed by GLP‐1RA initiators, while cohort 2 was composed by intra‐class switchers. In the paper by Yu et al20 the unmatched cohorts were considered. WMD, weighted mean difference; RR, risk ratio, Q and I2 are tests for homogeneity and heterogeneity of effect sizes
