
Figure 5.
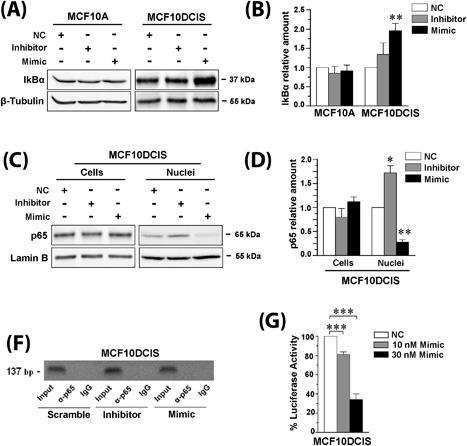
miR‐146a targets PLC‐β2 in MCF10DCIS cells. In (A) representative Western blot analysis with the indicated antibodies of MCF10A and MCF10DCIS cells transfected with miR‐146a inhibitor or mimic. In (B) amounts of IkBα as deduced from the densitometry of Western blot bands normalized with β‐Tubulin, used as internal control for equivalence of loaded proteins. The mean expression level of three separate experiments ± SD is shown. **P < 0.01 compared to transfection with scramble oligonucleotides. In (C) representative Western blot analysis with the anti‐p65 antibody of total cells and nuclear lysates from MCF10DCIS cells transfected with miR‐146a inhibitor or mimic. In (D) amounts of p65 as deduced from the densitometry of Western blot bands normalized with Lamin B, used as internal control for equivalence of loaded proteins. The mean expression level of three separate experiments ± SD is shown. *P < 0.05; **P < 0.01 compared to transfection with scramble oligonucleotides. In (E) representative analysis of in vivo recruitment of the p65 subunit of NF‐kB to human PLC‐β2 promoter by chromatin immunoprecipitation in MCF10DCIS cells transfected with miR‐146a inhibitor or mimic. The bands correspond to PCR products obtained amplifying a 137 bp DNA fragment encompassing a consensus‐binding site for NF‐kB. Input: genomic DNA not subjected to immunoprecipitation (positive control); IgG: samples immunoprecipitated with a non‐specific antibody (negative control). All experiments were performed in triplicate. In (F) percentage of luciferase activity in MCF10DCIS cells co‐transfected for 24 h with 250 ng of PLC‐β2 3′‐UTR luciferase reporter vector and with different concentrations of miR‐146a mimic. Values obtained from cells transfected with scramble miRNA sequences (NC: negative control) were taken as 100. The data are the mean of three separate experiments ± SD. ***P < 0.001