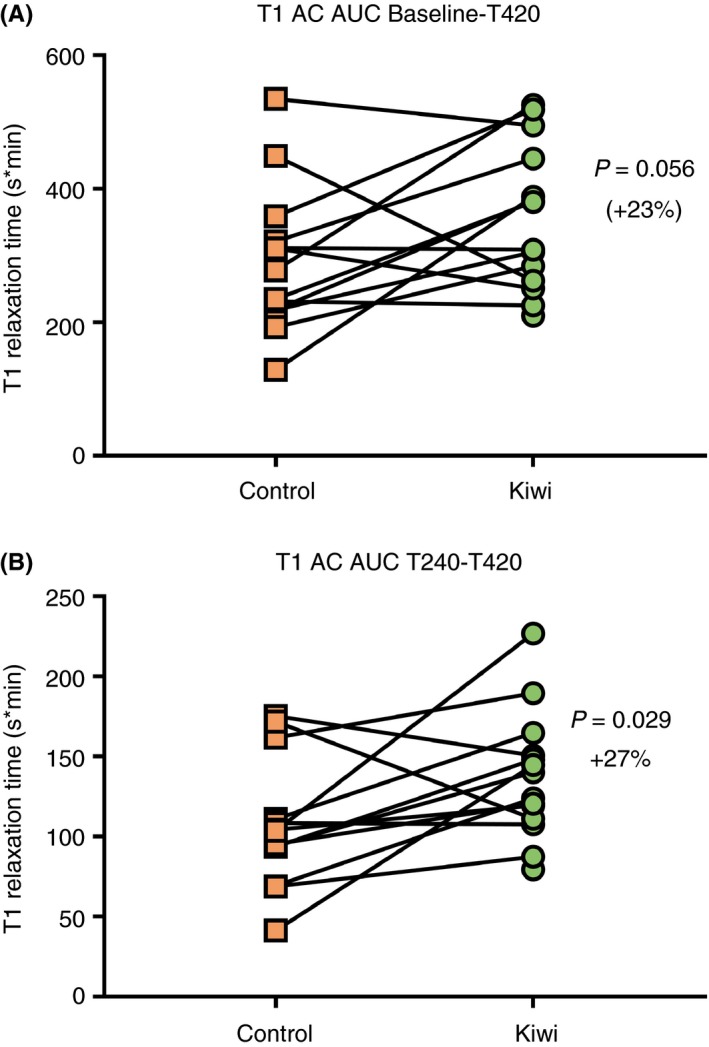
Figure 2.

T1 relaxation time in the ascending colon expressed as area under the curve from baseline until the end of the scan day (Baseline‐T420, A); and from the time that the first meal is assumed to have reached the ascending colon until the end of the scan day (T240‐T420, B)
