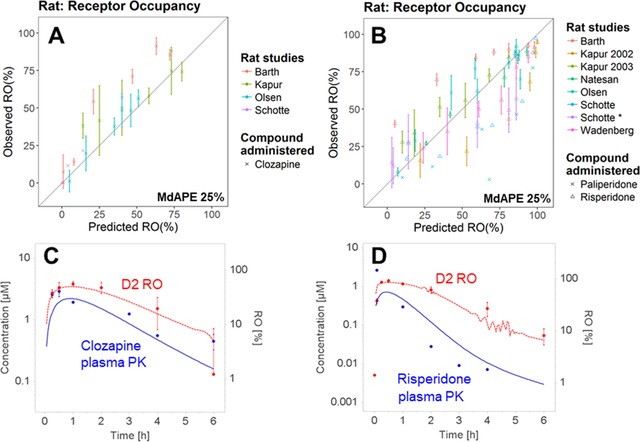
Figure 3.

Prediction performance of the rat PBPK model on D2 receptor occupancy (RO) after administration of clozapine (A) and risperidone and paliperidone (B) in multiple studies. Two examples are shown in (C) and (D). Observed (red dots) and predicted (red broken lines) D2 RO time profiles were obtained after subcutaneous administration of clozapine (C) and risperidone (D) according to the study of Olsen et al.53 The observed (blue dots) and predicted (blue solid lines) plasma concentration time profiles are also presented. Details of each study are summarized in Table S3 (risperidone) and Table S4 (clozapine). In (D) the oscillation of the simulated RO values at around Time = 4 hours could be caused by a numerical instability, which is further explained and with suggestion provided in Figure S3.
