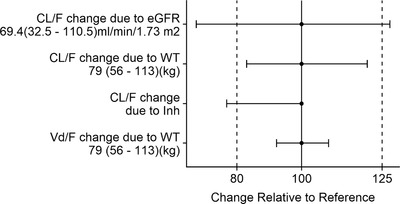
Figure 1.

Covariate impacts on CL/F and Vd/F. The bars represent the percentage change of each pharmacokinetic parameter from the base to the 5th and 95th percentile range of the covariate. The dashed lines represent the 80th and 125th percentiles, respectively. CL/F indicates total body clearance of the drug from plasma following extravascular administration; eGFR, estimated glomerular filtration rate; Inh, coadministration of an inhibitor of CYP3A4; Vd/F, apparent volume of administration; WT, body weight.
