Figure 8.

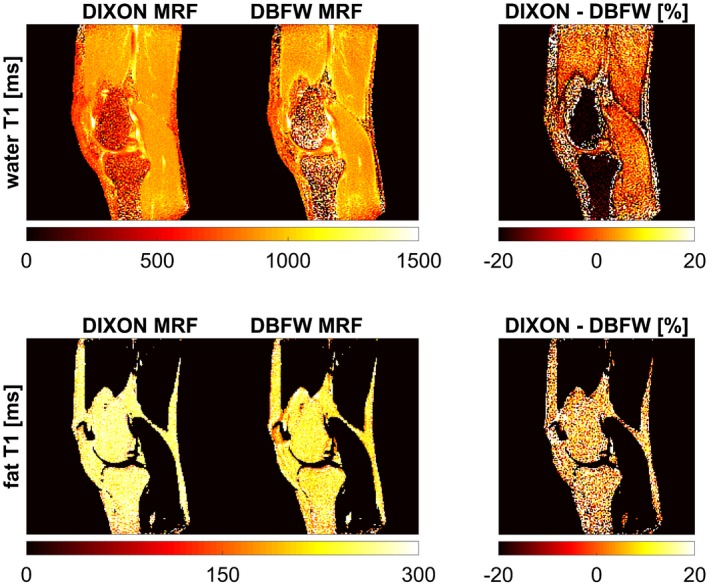
Maps of water T1 (first row) and fat T1 (second row) obtained with both DIXON MRF and DBFW MRF and corresponding percentage differences (with respect to DIXON MRF) for the in vivo experiment

Maps of water T1 (first row) and fat T1 (second row) obtained with both DIXON MRF and DBFW MRF and corresponding percentage differences (with respect to DIXON MRF) for the in vivo experiment