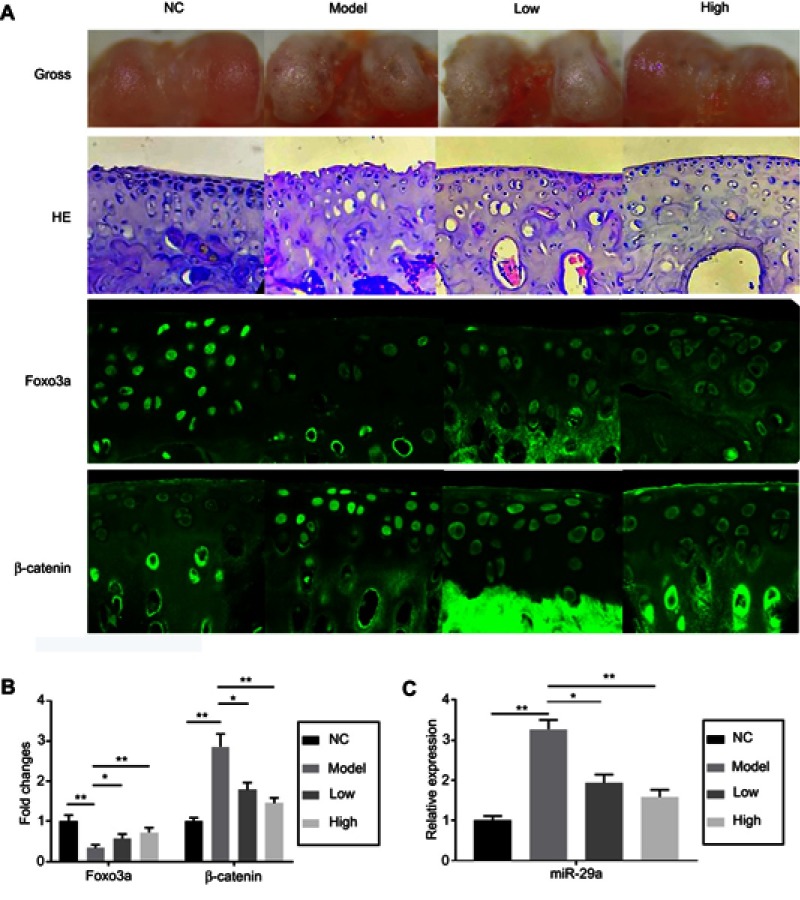
Figure 1.
The gross observation, hitomorphological examination, and immunofluorescence assays in rat joint cartilage. The groups were divided in NC (negative control group), Model (OA model group), Low (OA model +25 mg/kg TMF treatment), and High (OA model +100 mg/kg TMF treatment). After 8-week OA model establishment, rats were sacrificed. (A) Joint cartilage was collected for gross observation (the first array), hitomorphological examination by HE staining (the second array), and immunofluorescence assays of Foxo3a (the third array) and β-catenin (the fourth array). The fluorescence intensities of Foxo3a and β-catenin were indicated in the column figure (B), of which the data in the model and TMF-treated groups were compared with those in the NC group. Cartilage tissues were collected for extracting miR-29a, which was determined by qRT-PCR (C). Data were presented by mean ± SD of 6 replicates. P<0.05 was considered to be statistically significant (*P<0.05, **P<0.01, ***P<0.001).
Abbreviations: OA, Osteoarthritis; NC, negative control.

