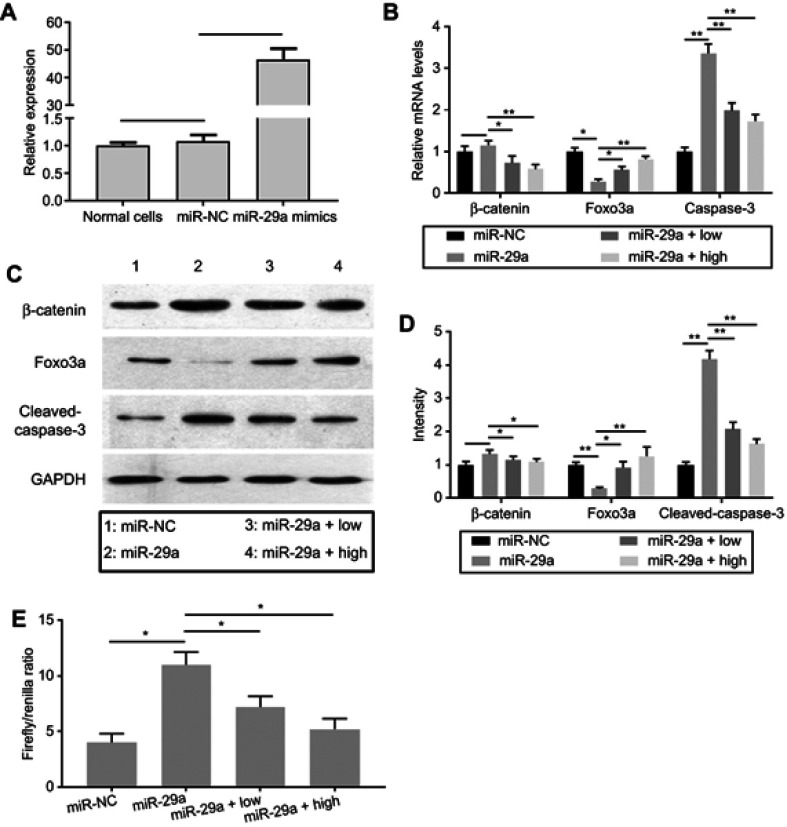
Figure 2.
Changes of β-catenin, Foxo3a, and cleaved-caspase-3 expression in miR-29a mimics-transfected chondrocytes.
Notes: (A) miR-29a mimics and miRNA mimic negative control (miR-NC) were transfected with chondrocytes. The expression of miR-29a was quantified by qRT-PCR. (B) After transfection of miR-29a mimics, the mRNA expressions of β-catenin, Foxo3a, and cleaved-caspase-3 were determined by qRT-PCR. (C and D) After transfection of miR-29a mimics, the protein expressions of β-catenin, Foxo3a, and cleaved-caspase-3 were determined by Western blot. The intensity of protein bands was indicated in the column. 1 (miR-NC group) (miR-NC), 2 (miR-29a mimics-transfected group) (miR-29a), 3 (miR-29a mimics-transfected group +5 μg/mL TMF treatment) (miR-29a + low), and 4 (miR-29a mimics-transfected group +20 μg/mL TMF treatment) (miR-29a + high). (E) Chondrocytes were co-transfected with miR-29a mimics and Topflash or Fopflash luciferase reporters. Transfected cultures were treated with 5 μg/mL (low) or 20 μg/mL TMF (high) for 24 hrs. The values were indicated as Firefly/Renilla ratio in the column. Data were presented by mean ± SD of 3 replicates. P<0.05 was considered to be statistically significant (*P<0.05, **P<0.01).

